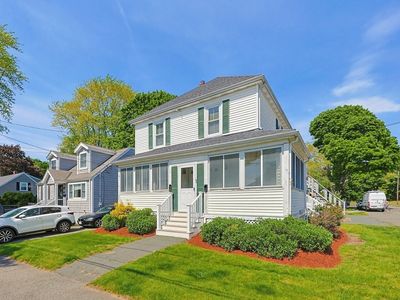
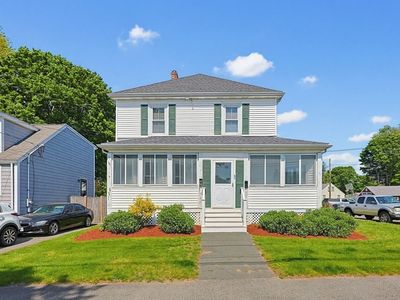
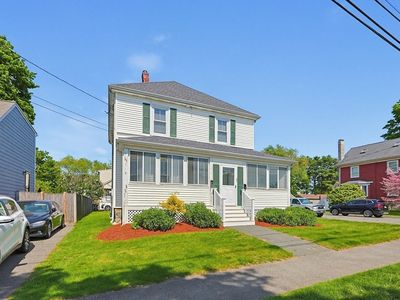
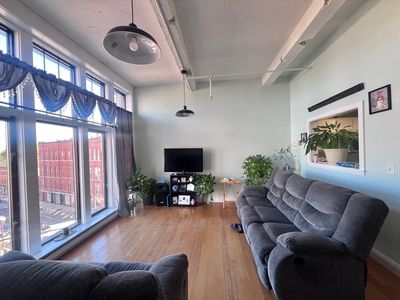
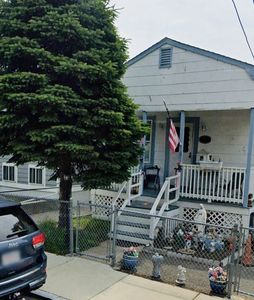
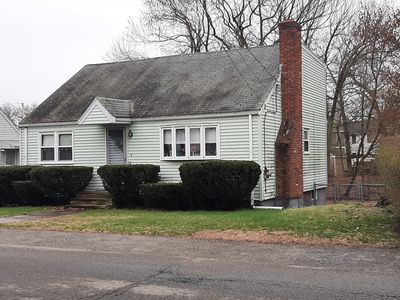
66 Lawrence StDanversMA01923
INVESTMENT ANALYSIS
Investment Verdict
Appreciation PlayNot all U.S. investment properties are valued for current income. 66 Lawrence St, Danvers, MA, 01923 in Danvers at $779,000, 4.23% gross yield, is a market-growth asset. Rental yield 4.23%. The $2,744/mo rent partially funds the $3,503/mo debt service; the core return is the 5%/yr price growth projected to add $215,223 over five years. Ziffy Mortgage's DSCR mortgage (0.78) provides financing for foreign nationals without domestic income checks. A 30–35% down payment often produces the cleanest coverage for low-yield properties. Total five-year return: $156,371.
| This Property | City Avg | |
|---|---|---|
| Gross Rental Yield | 4.2% | 6.5% |
| Monthly Cash Flow | $(2,166) | $450 |
City averages based on Danvers market data in our database. Property projections are estimates.
DSCR Rental Loan Qualification
Qualifies using the property's rental income, not your personal income.
- ✓No W-2, pay stubs, or tax returns needed
- ✓Rental income qualifies you
- ✓Built for real estate investors
| Monthly Rental Income | $2,744 |
| Total Monthly Debt Service | $4,600 |
| DSCR Ratio | 0.60x |
Ziffy Mortgage typically prefers a DSCR of 1.0+, but in some cases you may qualify with a DSCR below 1. To explore if this deal qualifies for an investment mortgage, book time with your loan officer →
Estimates assume 6.0% rate / 30-yr fixed, 30% down, 1% tax, 0.5% insurance. Not a commitment to lend.
Multi Family
Built in 1920
5,001 sqft lot
$N/A/sqft
No HOA
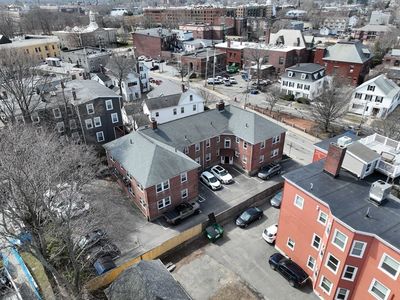
Neighborhood Data
Neighborhood data shown for ZIP Code: 01923, Danvers, MA area.
Housing Distribution
Housing Statistics
| Category | Value |
|---|---|
| Total HU (Housing Units) | 11,985 (100%) |
| Owner Occupied HU | 8,185 (68.3%) |
| Renter Occupied HU | 3,242 (27.1%) |
| Vacant Housing Units | 558 ( 4.7%) |
| Median Home Value | $677,909 |
| Average Home Value | $714,250 |
Housing Distribution
Address Breakdown
Residential
11,546
Single Family
8,892
Multi-Family
2,654
Businesses
1,526


Nearby investment properties with comparable rents

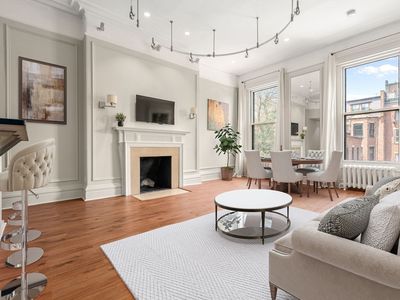
Nearby investment properties with comparable prices
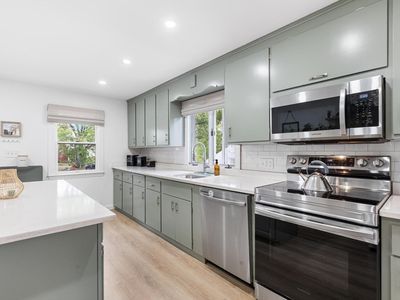

Ziffy AI Summary
A quick, investor-focused snapshot highlighting income strength, yield potential.
| Key metrics | Value |
|---|---|
| Price | $399,900 |
| Est. Rent | $3,200/mo |
| ROI | 18% |
- Attractive rent-to-price ratio for income stability
- Good fit for DSCR financing with healthy coverage
Multi Family
Built in 1920
5,001 sqft lot
$N/A/sqft
No HOA
Neighborhood Data
Neighborhood data shown for ZIP Code: 01923, Danvers, MA area.
Housing Distribution
Housing Statistics
| Category | Value |
|---|---|
| Total HU (Housing Units) | 11,985 (100%) |
| Owner Occupied HU | 8,185 (68.3%) |
| Renter Occupied HU | 3,242 (27.1%) |
| Vacant Housing Units | 558 ( 4.7%) |
| Median Home Value | $677,909 |
| Average Home Value | $714,250 |
Housing Distribution
Address Breakdown
Residential
11,546
Single Family
8,892
Multi-Family
2,654
Businesses
1,526
Nearby investment properties with comparable rents
Nearby investment properties with comparable prices
Listed by: N/A • N/A
Mls Name: MLS PIN
Mls ID: #73522576