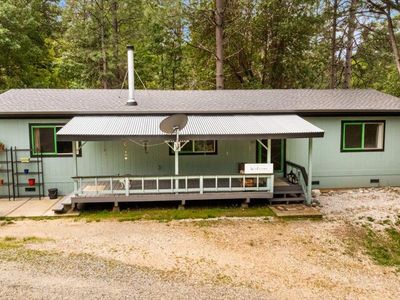
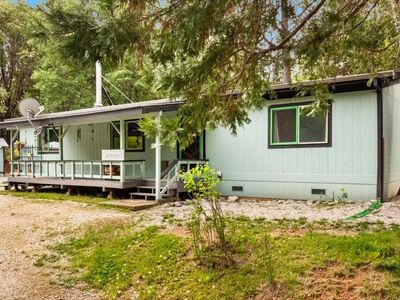
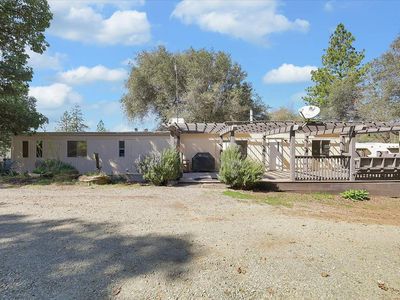
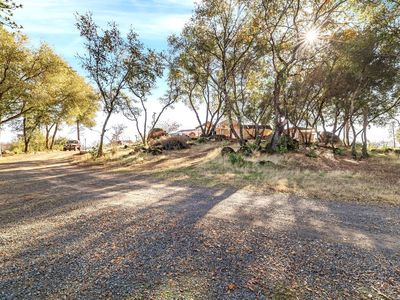
12495 Robinson RdNevada CityCA95959

INVESTMENT ANALYSIS
Investment Verdict
Strong Cash FlowIf cash-on-cash performance is your primary filter, 12495 Robinson Rd, Nevada City, CA, 95959 in Nevada City deserves attention. This $320,000 property earns $2,887/mo in rent, a 10.83% gross yield, and nets $908/mo after the $1,439/mo payment. DSCR 2.01 makes it one of the cleaner DSCR underwriting candidates Ziffy Mortgage sees in this market. Five-year appreciation of $88,410 compounds alongside $2,947/yr in yearly equity build, for a total cumulative return of $179,744.
| This Property | National Avg | |
|---|---|---|
| Gross Rental Yield | 10.8% | 6.2% |
| Monthly Cash Flow | $908 | $180 |
National averages based on 2024–2025 U.S. residential rental market data. Content is user-generated and unverified.
DSCR Rental Loan Qualification
Qualifies using the property's rental income, not your personal income.
- ✓No W-2, pay stubs, or tax returns needed
- ✓Rental income qualifies you
- ✓Built for real estate investors
| Monthly Rental Income | $2,887 |
| Total Monthly Debt Service | $1,852 |
| DSCR Ratio | 1.56x |
Ziffy Mortgage: Your DSCR most likely meets our 1.0+ requirement, so you'll most probably qualify for our standard DSCR investment loan program. To pre-qualify, book time with your loan officer →
Estimates assume 6.0% rate / 30-yr fixed, 30% down, 1% tax, 0.5% insurance. Not a commitment to lend.
Single Family
Built in 1983
1.37 Acres lot
$N/A/sqft
No HOA
Neighborhood Data
Neighborhood data shown for ZIP Code: 95959, Nevada City, CA area.
Housing Distribution
Housing Statistics
| Category | Value |
|---|---|
| Total HU (Housing Units) | 9,494 (100%) |
| Owner Occupied HU | 6,437 (67.8%) |
| Renter Occupied HU | 1,900 (20.0%) |
| Vacant Housing Units | 1,157 (12.2%) |
| Median Home Value | $697,917 |
| Average Home Value | $750,661 |
Housing Distribution
Address Breakdown
Residential
7,882
Single Family
7,770
Multi-Family
112
Businesses
748


Nearby investment properties with comparable rents
Nearby investment properties with comparable prices

Ziffy AI Summary
A quick, investor-focused snapshot highlighting income strength, yield potential.
| Key metrics | Value |
|---|---|
| Price | $399,900 |
| Est. Rent | $3,200/mo |
| ROI | 18% |
- Attractive rent-to-price ratio for income stability
- Good fit for DSCR financing with healthy coverage
Single Family
Built in 1983
1.37 Acres lot
$N/A/sqft
No HOA
Neighborhood Data
Neighborhood data shown for ZIP Code: 95959, Nevada City, CA area.
Housing Distribution
Housing Statistics
| Category | Value |
|---|---|
| Total HU (Housing Units) | 9,494 (100%) |
| Owner Occupied HU | 6,437 (67.8%) |
| Renter Occupied HU | 1,900 (20.0%) |
| Vacant Housing Units | 1,157 (12.2%) |
| Median Home Value | $697,917 |
| Average Home Value | $750,661 |
Housing Distribution
Address Breakdown
Residential
7,882
Single Family
7,770
Multi-Family
112
Businesses
748
Nearby investment properties with comparable rents
Nearby investment properties with comparable prices
Listed by: Lucille Allen • RE/MAX Gold
Mls Name: MetroList Services of CA
Mls Provider:
Mls ID: #225053686
Disclaimer: Every person who intends to view or use such MLS information agrees to Terms of Use that include the following terms and conditions:All measurements and all calculations of area (i.e., Sq Ft and Acreage) are approximate. Broker has represented to MetroList that Broker has a valid listing signed by seller authorizing placement in the MLS. Above information is provided by Seller and/or other sources and has not been verified by Broker. Copyright 2025 MetroList Services, Inc. Information being provided by Metrolist Services, Inc. is for consumers' personal, non-commercial use and may not be used for any purpose other than to identify prospective properties consumers may be interested in purchasing. [Click here for more information](/mls-disclaimers/#16)