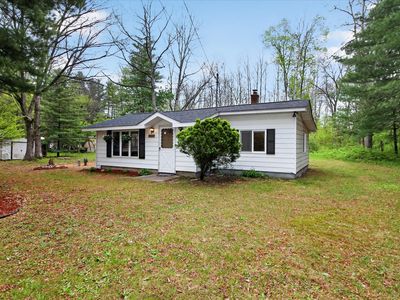
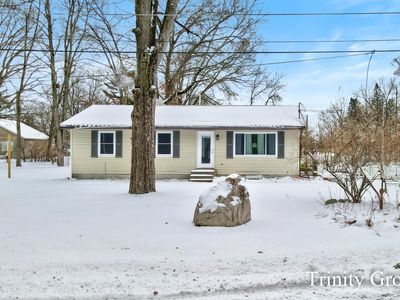
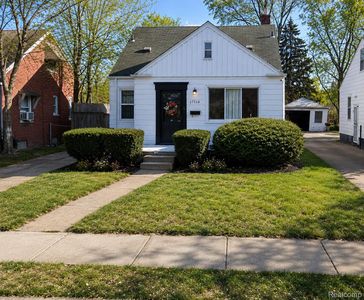
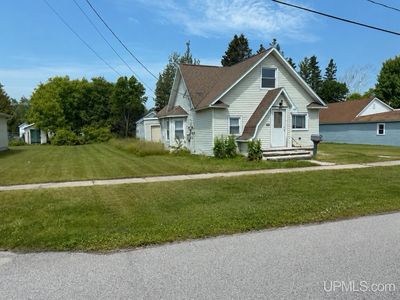
Fix And Flip Investment Properties for Sale in Newaygo, MI

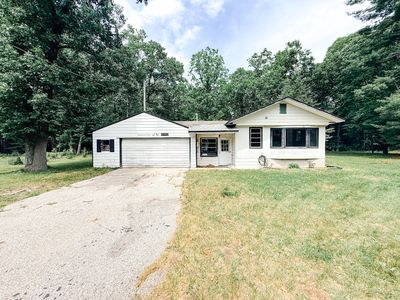
 163
163- 1 Bed
- 1 Bath
- 800 sft
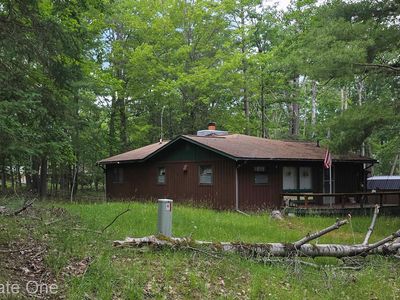
 182
182- 4 Bed
- 2 Bath
- 1685 sft
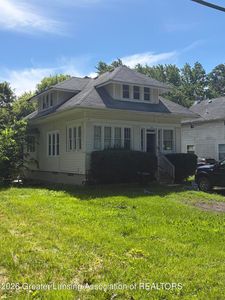
 139
139- 3 Bed
- 1 Bath
- 964 sft
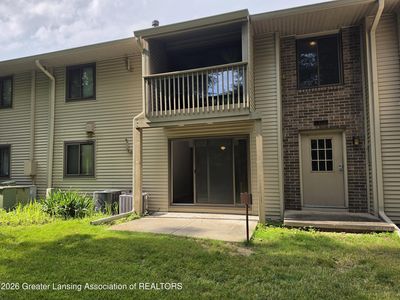
 116
116- 3 Bed
- 1 Bath
- 854 sft
 102
102- 2 Bed
- 1 Bath
- 1042 sft
- 3 Bed
- 2 Bath
- 1400 sft
 849
849- 3 Bed
- 2 Bath
- 1380 sft
- 1 Bed
- 1 Bath
- 621 sft
 901
901- 3 Bed
- 2 Bath
- 1216 sft
 751
751- 2 Bed
- 1 Bath
- 1132 sft
 638
638- 3 Bed
- 1 Bath
- 1320 sft
 96
96- 5 Bed
- 2 Bath
- 2300 sft
 135
135- - Bed
- 1 Bath
- 628 sft
 129
129- 2 Bed
- 1 Bath
- 820 sft
 119
119- 1 Bed
- 1 Bath
- 780 sft
 110
110- 1 Bed
- 1 Bath
- 360 sft
 471
471- 5 Bed
- 2 Bath
- 1926 sft
 106
106- 3 Bed
- 1 Bath
- 1278 sft
 753
753- 3 Bed
- 2 Bath
- 737 sft
 808
808- 3 Bed
- 2 Bath
- 2185 sft
 93
93- 2 Bed
- 1 Bath
- 867 sft
 111
111- 2 Bed
- 1 Bath
- 940 sft
 93
93- 5 Bed
- 1 Bath
- 1466 sft
 646
646- 5 Bed
- 2 Bath
- 988 sft
 93
93- 4 Bed
- 2 Bath
- 1680 sft
 136
136- 3 Bed
- 1 Bath
- 887 sft
Why Invest in Newaygo, Michigan?
Investors looking for fix and flip opportunities in Newaygo, MI can take advantage of competitive cap rates averaging around 7.5%. The local market shows stable rental yields of approximately 6%, with average cash flow near $600 per property. Appreciation rates in Newaygo have been steady at about 3% annually, supported by a renter-occupied rate of 55%. These metrics point to a balanced market suitable for investors focused on medium-term gains and quick turnaround of residential properties.
Frequently Asked Questions
Average returns for fix and flip investments in Newaygo hover around 11.5% ROI, supported by strong cap rates near 7.5%. These returns are driven by moderate appreciation and stable rental yields.
Find Your Perfect Investment Property in Newaygo, Michigan
Explore investment opportunities by strategy, performance, or property type
