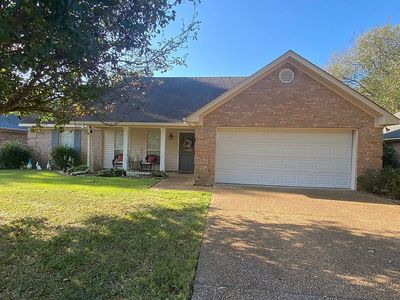
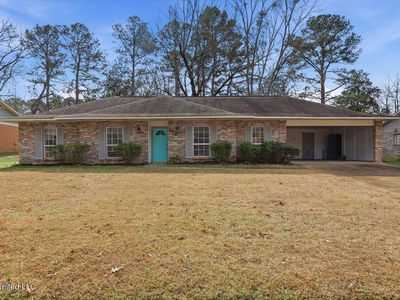
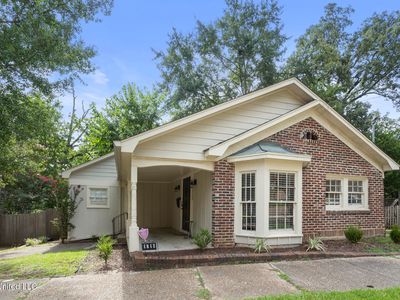
895 Windward DrRichlandMS39218
INVESTMENT ANALYSIS
Investment Verdict
Strong Cash FlowIf cash-on-cash performance is your primary filter, 895 Windward Dr, Richland, MS, 39218 in Richland deserves attention. This $238,000 property earns $2,281/mo in rent, a 11.5% gross yield, and nets $825/mo after the $1,070/mo payment. DSCR 2.13 makes it one of the cleaner DSCR underwriting candidates Ziffy Mortgage sees in this market. Five-year appreciation of $65,755 compounds alongside $2,192/yr in yearly equity build, for a total cumulative return of $143,265.
| This Property | National Avg | |
|---|---|---|
| Gross Rental Yield | 11.5% | 6.2% |
| Monthly Cash Flow | $825 | $180 |
National averages based on 2024–2025 U.S. residential rental market data. Content is user-generated and unverified.
DSCR Rental Loan Qualification
Qualifies using the property's rental income, not your personal income.
- ✓No W-2, pay stubs, or tax returns needed
- ✓Rental income qualifies you
- ✓Built for real estate investors
| Monthly Rental Income | $2,281 |
| Total Monthly Debt Service | $1,362 |
| DSCR Ratio | 1.68x |
Ziffy Mortgage: Your DSCR most likely meets our 1.0+ requirement, so you'll most probably qualify for our standard DSCR investment loan program. To pre-qualify, book time with your loan officer →
Estimates assume 6.0% rate / 30-yr fixed, 30% down, 1% tax, 0.5% insurance. Not a commitment to lend.
Single Family
Built in 2000
N/A lot
$N/A/sqft
No HOA
Neighborhood Data
Neighborhood data shown for ZIP Code: 39218, Richland, MS area.
Housing Distribution
Housing Statistics
| Category | Value |
|---|---|
| Total HU (Housing Units) | 2,793 (100%) |
| Owner Occupied HU | 1,787 (64.0%) |
| Renter Occupied HU | 773 (27.7%) |
| Vacant Housing Units | 233 ( 8.3%) |
| Median Home Value | $169,424 |
| Average Home Value | $194,079 |
Housing Distribution
Address Breakdown
Residential
2,965
Single Family
2,261
Multi-Family
704
Businesses
526


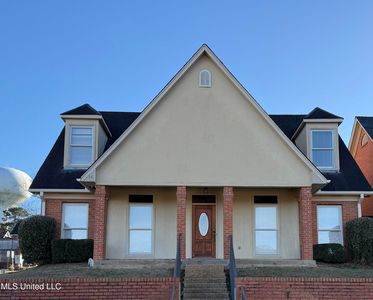
Nearby investment properties with comparable rents
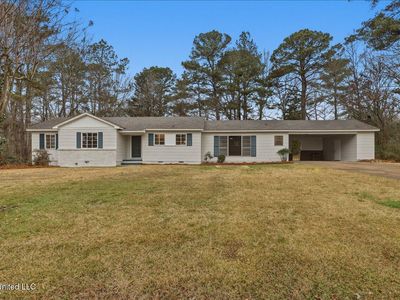
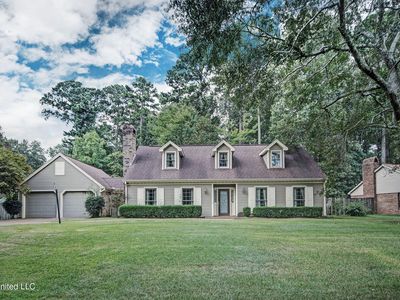
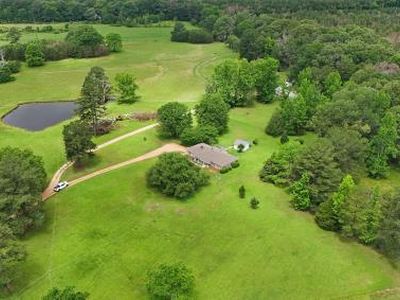
Nearby investment properties with comparable prices
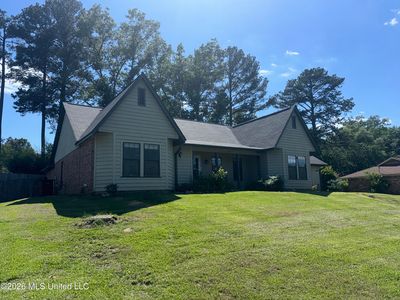
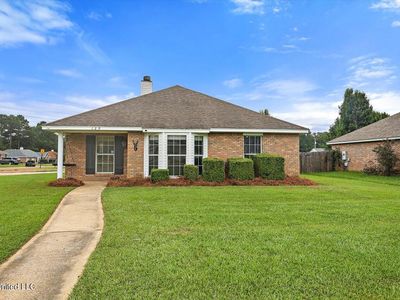

Ziffy AI Summary
A quick, investor-focused snapshot highlighting income strength, yield potential.
| Key metrics | Value |
|---|---|
| Price | $399,900 |
| Est. Rent | $3,200/mo |
| ROI | 18% |
- Attractive rent-to-price ratio for income stability
- Good fit for DSCR financing with healthy coverage
Single Family
Built in 2000
N/A lot
$N/A/sqft
No HOA
Neighborhood Data
Neighborhood data shown for ZIP Code: 39218, Richland, MS area.
Housing Distribution
Housing Statistics
| Category | Value |
|---|---|
| Total HU (Housing Units) | 2,793 (100%) |
| Owner Occupied HU | 1,787 (64.0%) |
| Renter Occupied HU | 773 (27.7%) |
| Vacant Housing Units | 233 ( 8.3%) |
| Median Home Value | $169,424 |
| Average Home Value | $194,079 |
Housing Distribution
Address Breakdown
Residential
2,965
Single Family
2,261
Multi-Family
704
Businesses
526
Nearby investment properties with comparable rents
Nearby investment properties with comparable prices
Listed by: N/A • N/A
Mls Name: undefined
Mls ID: #N/A