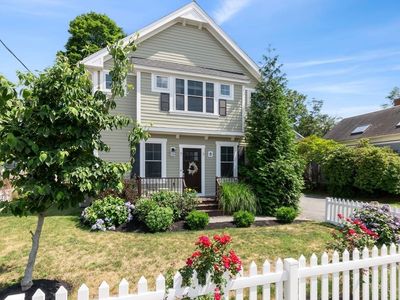
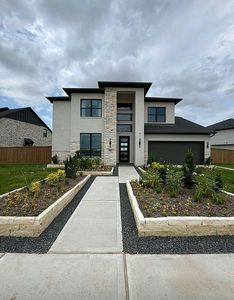
8-8A Sylvan St #ADanversMA01923
INVESTMENT ANALYSIS
Investment Verdict
Appreciation PlayYield and appreciation often trade off, and at 8-8A Sylvan St #A, Danvers, MA, 01923 in Danvers the bet is firmly on appreciation. Rental yield 5.72%. The 5.72% gross yield on a $604,000 price is below income-first thresholds, but 5%/yr value growth projects $166,874 in equity by year five. Ziffy Mortgage's non-U.S. DSCR mortgage (1.06) finances the acquisition on rental income alone. A larger down payment (30–35%) reduces monthly debt service and tightens the spread. Total projected cumulative return: $157,706.
| This Property | City Avg | |
|---|---|---|
| Gross Rental Yield | 5.7% | 6.5% |
| Monthly Cash Flow | $(1,127) | $450 |
City averages based on Danvers market data in our database. Property projections are estimates.
DSCR Rental Loan Qualification
Qualifies using the property's rental income, not your personal income.
- ✓No W-2, pay stubs, or tax returns needed
- ✓Rental income qualifies you
- ✓Built for real estate investors
| Monthly Rental Income | $2,880 |
| Total Monthly Debt Service | $3,767 |
| DSCR Ratio | 0.76x |
Ziffy Mortgage typically prefers a DSCR of 1.0+, but in some cases you may qualify with a DSCR below 1. To explore if this deal qualifies for an investment mortgage, book time with your loan officer →
Estimates assume 6.0% rate / 30-yr fixed, 30% down, 1% tax, 0.5% insurance. Not a commitment to lend.
Townhouse
Built in 2015
N/A lot
$N/A/sqft
$200 monthly HOA
Neighborhood Data
Neighborhood data shown for ZIP Code: 01923, Danvers, MA area.
Housing Distribution
Housing Statistics
| Category | Value |
|---|---|
| Total HU (Housing Units) | 11,985 (100%) |
| Owner Occupied HU | 8,185 (68.3%) |
| Renter Occupied HU | 3,242 (27.1%) |
| Vacant Housing Units | 558 ( 4.7%) |
| Median Home Value | $677,909 |
| Average Home Value | $714,250 |
Housing Distribution
Address Breakdown
Residential
11,546
Single Family
8,892
Multi-Family
2,654
Businesses
1,526


Nearby investment properties with comparable rents

Nearby investment properties with comparable prices


Ziffy AI Summary
A quick, investor-focused snapshot highlighting income strength, yield potential.
| Key metrics | Value |
|---|---|
| Price | $399,900 |
| Est. Rent | $3,200/mo |
| ROI | 18% |
- Attractive rent-to-price ratio for income stability
- Good fit for DSCR financing with healthy coverage
Townhouse
Built in 2015
N/A lot
$N/A/sqft
$200 monthly HOA
Neighborhood Data
Neighborhood data shown for ZIP Code: 01923, Danvers, MA area.
Housing Distribution
Housing Statistics
| Category | Value |
|---|---|
| Total HU (Housing Units) | 11,985 (100%) |
| Owner Occupied HU | 8,185 (68.3%) |
| Renter Occupied HU | 3,242 (27.1%) |
| Vacant Housing Units | 558 ( 4.7%) |
| Median Home Value | $677,909 |
| Average Home Value | $714,250 |
Housing Distribution
Address Breakdown
Residential
11,546
Single Family
8,892
Multi-Family
2,654
Businesses
1,526
Nearby investment properties with comparable rents
Nearby investment properties with comparable prices
Listed by: LeeAnne Trohon • LAER Realty Partners
Mls Name: MLS PIN
Mls ID: #73405629
Disclaimer: The property listing data and information set forth herein were provided to MLS Property Information Network, Inc. from third party sources, including sellers, lessors and public records, and were compiled by MLS Property Information Network, Inc. The property listing data and information are for the personal, non commercial use of consumers having a good faith interest in purchasing or leasing listed properties of the type displayed to them and may not be used for any purpose other than to identify prospective properties which such consumers may have a good faith interest in purchasing or leasing. MLS Property Information Network, Inc. and its subscribers disclaim any and all representations and warranties as to the accuracy of the property listing data and information set forth herein. The MLS listing information displayed is deemed reliable, but is not guaranteed accurate by the MLS.