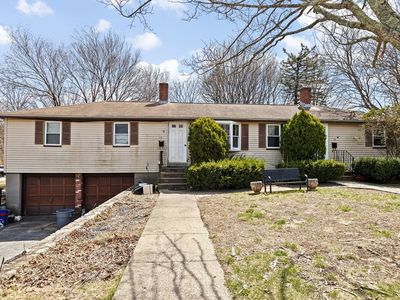
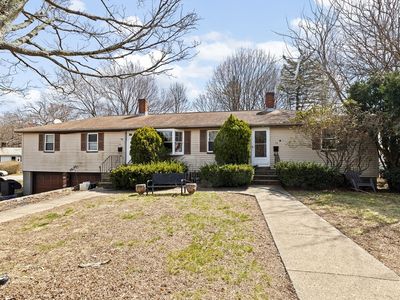
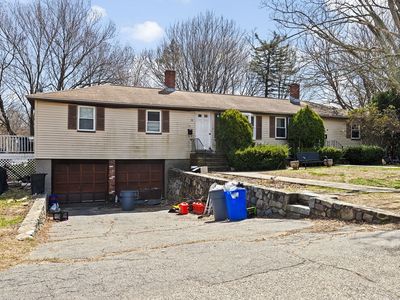
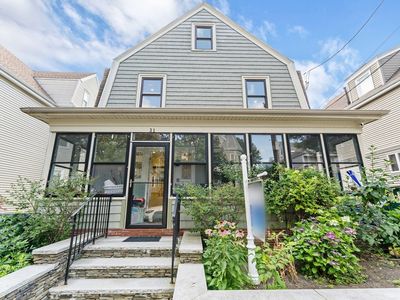
34-36 Fottler RdHinghamMA02043
INVESTMENT ANALYSIS
Investment Verdict
Strong Cash FlowStrong cash flow defines 34-36 Fottler Rd, Hingham, MA, 02043 in Hingham: $6,960/mo in rent, $1,798/mo net, 10.2% gross yield, all on a $819,000 acquisition. The 1.89 coverage ratio comfortably clears Ziffy Mortgage's threshold, enabling foreign-national buyers to close without U.S. credit documentation. Over five years, 5% appreciation adds $226,275 in value, and $7,543/yr in principal paydown steadily builds equity. Projected total cumulative return: $426,666.
| This Property | City Avg | |
|---|---|---|
| Gross Rental Yield | 10.2% | 5.2% |
| Monthly Cash Flow | $1,798 | $500 |
City averages based on Hingham market data in our database. Property projections are estimates.
DSCR Rental Loan Qualification
Qualifies using the property's rental income, not your personal income.
- ✓No W-2, pay stubs, or tax returns needed
- ✓Rental income qualifies you
- ✓Built for real estate investors
| Monthly Rental Income | $6,960 |
| Total Monthly Debt Service | $4,836 |
| DSCR Ratio | 1.44x |
Ziffy Mortgage: Your DSCR most likely meets our 1.0+ requirement, so you'll most probably qualify for our standard DSCR investment loan program. To pre-qualify, book time with your loan officer →
Estimates assume 6.0% rate / 30-yr fixed, 30% down, 1% tax, 0.5% insurance. Not a commitment to lend.
Multi Family
Built in 1950
0.39 Acres lot
$N/A/sqft
No HOA
Neighborhood Data
Neighborhood data shown for ZIP Code: 02043, Hingham, MA area.
Housing Distribution
Housing Statistics
| Category | Value |
|---|---|
| Total HU (Housing Units) | 10,276 (100%) |
| Owner Occupied HU | 7,412 (72.1%) |
| Renter Occupied HU | 2,102 (20.5%) |
| Vacant Housing Units | 762 ( 7.4%) |
| Median Home Value | $1,169,044 |
| Average Home Value | $1,240,940 |
Housing Distribution
Address Breakdown
Residential
9,851
Single Family
7,644
Multi-Family
2,207
Businesses
1,116


Nearby investment properties with comparable rents
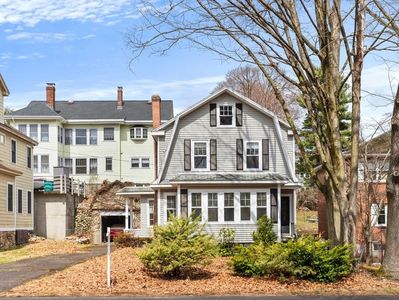

Nearby investment properties with comparable prices


Ziffy AI Summary
A quick, investor-focused snapshot highlighting income strength, yield potential.
| Key metrics | Value |
|---|---|
| Price | $399,900 |
| Est. Rent | $3,200/mo |
| ROI | 18% |
- Attractive rent-to-price ratio for income stability
- Good fit for DSCR financing with healthy coverage
Multi Family
Built in 1950
0.39 Acres lot
$N/A/sqft
No HOA
Neighborhood Data
Neighborhood data shown for ZIP Code: 02043, Hingham, MA area.
Housing Distribution
Housing Statistics
| Category | Value |
|---|---|
| Total HU (Housing Units) | 10,276 (100%) |
| Owner Occupied HU | 7,412 (72.1%) |
| Renter Occupied HU | 2,102 (20.5%) |
| Vacant Housing Units | 762 ( 7.4%) |
| Median Home Value | $1,169,044 |
| Average Home Value | $1,240,940 |
Housing Distribution
Address Breakdown
Residential
9,851
Single Family
7,644
Multi-Family
2,207
Businesses
1,116
Nearby investment properties with comparable rents
Nearby investment properties with comparable prices
Listed by: The Bill Good Team • Compass
Mls Name: MLS PIN
Mls ID: #73355039
Disclaimer: The property listing data and information set forth herein were provided to MLS Property Information Network, Inc. from third party sources, including sellers, lessors and public records, and were compiled by MLS Property Information Network, Inc. The property listing data and information are for the personal, non commercial use of consumers having a good faith interest in purchasing or leasing listed properties of the type displayed to them and may not be used for any purpose other than to identify prospective properties which such consumers may have a good faith interest in purchasing or leasing. MLS Property Information Network, Inc. and its subscribers disclaim any and all representations and warranties as to the accuracy of the property listing data and information set forth herein.