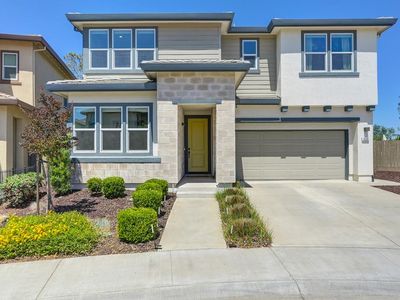
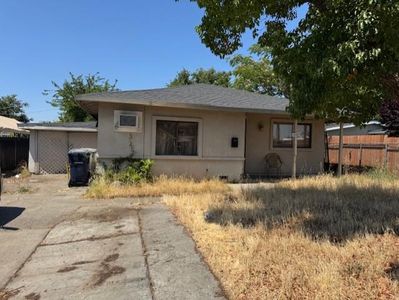
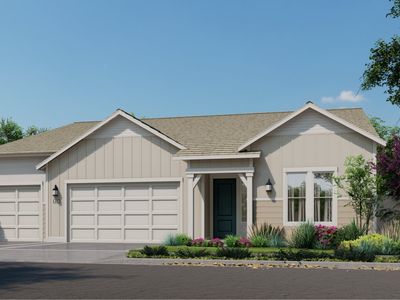
328 Chan CtFolsomCA95630
INVESTMENT ANALYSIS
Investment Verdict
Appreciation PlayGlobal investors willing to prioritise equity over near-term yield will find 328 Chan Ct, Folsom, CA, 95630 in Folsom worth study. Rental yield 3.71%. The 3.71% gross yield is below cash-flow benchmarks at $830,000, but 5% annual appreciation, adding $229,314 over five years, frames this as a capital growth position. Rent of $2,569/mo partially offsets the $3,732/mo payment. Ziffy Mortgage finances appreciation-play properties (0.69 DSCR) for non-U.S. residents without domestic income documentation; a 30–35% down payment maximises coverage. Total projected return: $142,122.
| This Property | City Avg | |
|---|---|---|
| Gross Rental Yield | 3.7% | 5.5% |
| Monthly Cash Flow | $(2,690) | $300 |
City averages based on Folsom market data in our database. Property projections are estimates.
DSCR Rental Loan Qualification
Qualifies using the property's rental income, not your personal income.
- ✓No W-2, pay stubs, or tax returns needed
- ✓Rental income qualifies you
- ✓Built for real estate investors
| Monthly Rental Income | $2,569 |
| Total Monthly Debt Service | $4,929 |
| DSCR Ratio | 0.52x |
Ziffy Mortgage typically prefers a DSCR of 1.0+, but in some cases you may qualify with a DSCR below 1. To explore if this deal qualifies for an investment mortgage, book time with your loan officer →
Estimates assume 6.0% rate / 30-yr fixed, 30% down, 1% tax, 0.5% insurance. Not a commitment to lend.
Single Family
Built in 2018
4,500 sqft lot
$N/A/sqft
$125 monthly HOA
Neighborhood Data
Neighborhood data shown for ZIP Code: 95630, Folsom, CA area.
Housing Distribution
Housing Statistics
| Category | Value |
|---|---|
| Total HU (Housing Units) | 34,418 (100%) |
| Owner Occupied HU | 22,461 (65.3%) |
| Renter Occupied HU | 9,898 (28.8%) |
| Vacant Housing Units | 2,059 ( 6.0%) |
| Median Home Value | $732,244 |
| Average Home Value | $749,661 |
Housing Distribution
Address Breakdown
Residential
32,491
Single Family
26,905
Multi-Family
5,586
Businesses
2,075


Nearby investment properties with comparable rents

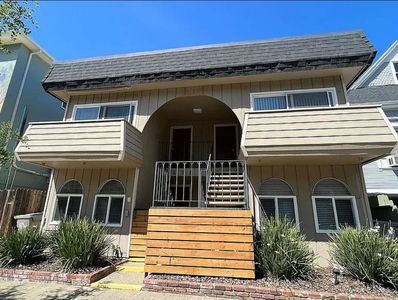
Nearby investment properties with comparable prices
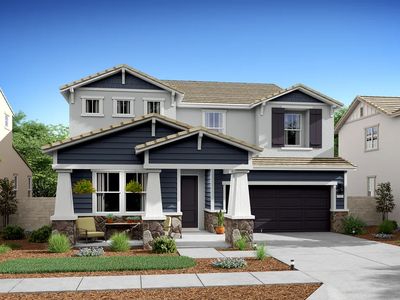
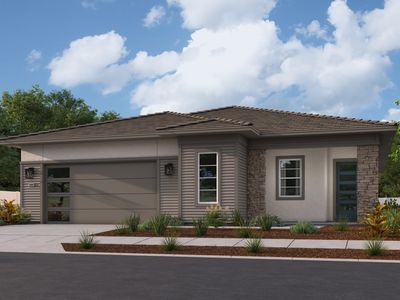

Ziffy AI Summary
A quick, investor-focused snapshot highlighting income strength, yield potential.
| Key metrics | Value |
|---|---|
| Price | $399,900 |
| Est. Rent | $3,200/mo |
| ROI | 18% |
- Attractive rent-to-price ratio for income stability
- Good fit for DSCR financing with healthy coverage
Single Family
Built in 2018
4,500 sqft lot
$N/A/sqft
$125 monthly HOA
Neighborhood Data
Neighborhood data shown for ZIP Code: 95630, Folsom, CA area.
Housing Distribution
Housing Statistics
| Category | Value |
|---|---|
| Total HU (Housing Units) | 34,418 (100%) |
| Owner Occupied HU | 22,461 (65.3%) |
| Renter Occupied HU | 9,898 (28.8%) |
| Vacant Housing Units | 2,059 ( 6.0%) |
| Median Home Value | $732,244 |
| Average Home Value | $749,661 |
Housing Distribution
Address Breakdown
Residential
32,491
Single Family
26,905
Multi-Family
5,586
Businesses
2,075
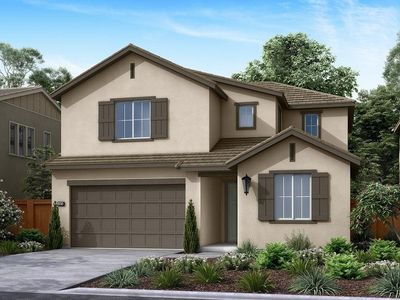
Nearby investment properties with comparable rents
Nearby investment properties with comparable prices
Listed by: Tammy Collins • HomeSmart ICARE Realty
Mls Name: MetroList Services of CA
Mls Provider:
Mls ID: #225085700
Disclaimer: Every person who intends to view or use such MLS information agrees to Terms of Use that include the following terms and conditions:All measurements and all calculations of area (i.e., Sq Ft and Acreage) are approximate. Broker has represented to MetroList that Broker has a valid listing signed by seller authorizing placement in the MLS. Above information is provided by Seller and/or other sources and has not been verified by Broker. Copyright 2025 MetroList Services, Inc. Information being provided by Metrolist Services, Inc. is for consumers' personal, non-commercial use and may not be used for any purpose other than to identify prospective properties consumers may be interested in purchasing. [Click here for more information](/mls-disclaimers/#16)