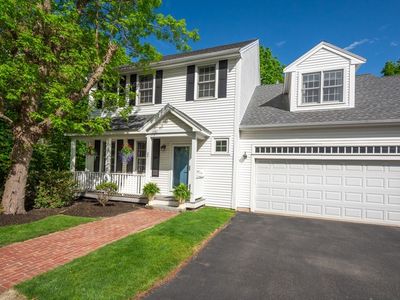
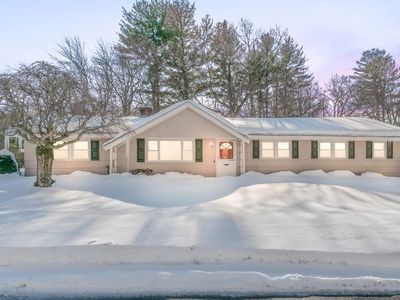
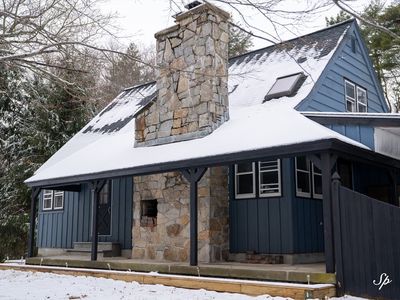
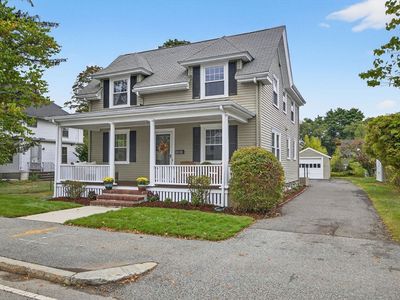
22 Greendale Ave #22Needham HeightsMA02494

INVESTMENT ANALYSIS
Investment Verdict
Appreciation PlayGlobal investors willing to prioritise equity over near-term yield will find 22 Greendale Ave #22, Needham Heights, MA, 02494 in Needham Heights worth study. Rental yield 4.31%. The 4.31% gross yield is below cash-flow benchmarks at $1,462,500, but 5% annual appreciation, adding $404,062 over five years, frames this as a capital growth position. Rent of $5,256/mo partially offsets the $6,576/mo payment. Ziffy Mortgage finances appreciation-play properties (0.80 DSCR) for non-U.S. residents without domestic income documentation; a 30–35% down payment maximises coverage. Total projected return: $262,855.
| This Property | City Avg | |
|---|---|---|
| Gross Rental Yield | 4.3% | 5.0% |
| Monthly Cash Flow | $(4,587) | $800 |
City averages based on Needham Heights market data in our database. Property projections are estimates.
DSCR Rental Loan Qualification
Qualifies using the property's rental income, not your personal income.
- ✓No W-2, pay stubs, or tax returns needed
- ✓Rental income qualifies you
- ✓Built for real estate investors
| Monthly Rental Income | $5,256 |
| Total Monthly Debt Service | $9,261 |
| DSCR Ratio | 0.57x |
Ziffy Mortgage typically prefers a DSCR of 1.0+, but in some cases you may qualify with a DSCR below 1. To explore if this deal qualifies for an investment mortgage, book time with your loan officer →
Estimates assume 6.0% rate / 30-yr fixed, 30% down, 1% tax, 0.5% insurance. Not a commitment to lend.
Townhouse
Built in 1997
N/A lot
$N/A/sqft
$625 monthly HOA
Neighborhood Data
Neighborhood data shown for ZIP Code: 02494, Needham Heights, MA area.
Housing Distribution
Housing Statistics
| Category | Value |
|---|---|
| Total HU (Housing Units) | 4,424 (100%) |
| Owner Occupied HU | 2,729 (61.7%) |
| Renter Occupied HU | 1,359 (30.7%) |
| Vacant Housing Units | 336 ( 7.6%) |
| Median Home Value | $1,132,830 |
| Average Home Value | $1,231,080 |
Housing Distribution
Address Breakdown
Residential
4,439
Single Family
3,096
Multi-Family
1,343
Businesses
829


Nearby investment properties with comparable rents
Nearby investment properties with comparable prices


Ziffy AI Summary
A quick, investor-focused snapshot highlighting income strength, yield potential.
| Key metrics | Value |
|---|---|
| Price | $399,900 |
| Est. Rent | $3,200/mo |
| ROI | 18% |
- Attractive rent-to-price ratio for income stability
- Good fit for DSCR financing with healthy coverage
Townhouse
Built in 1997
N/A lot
$N/A/sqft
$625 monthly HOA
Neighborhood Data
Neighborhood data shown for ZIP Code: 02494, Needham Heights, MA area.
Housing Distribution
Housing Statistics
| Category | Value |
|---|---|
| Total HU (Housing Units) | 4,424 (100%) |
| Owner Occupied HU | 2,729 (61.7%) |
| Renter Occupied HU | 1,359 (30.7%) |
| Vacant Housing Units | 336 ( 7.6%) |
| Median Home Value | $1,132,830 |
| Average Home Value | $1,231,080 |
Housing Distribution
Address Breakdown
Residential
4,439
Single Family
3,096
Multi-Family
1,343
Businesses
829
Nearby investment properties with comparable rents
Nearby investment properties with comparable prices
Listed by: Patrick Geraghty • Berkshire Hathaway HomeServices Commonwealth Real Estate
Mls Name: MLS PIN
Mls ID: #73374441
Disclaimer: The property listing data and information set forth herein were provided to MLS Property Information Network, Inc. from third party sources, including sellers, lessors and public records, and were compiled by MLS Property Information Network, Inc. The property listing data and information are for the personal, non commercial use of consumers having a good faith interest in purchasing or leasing listed properties of the type displayed to them and may not be used for any purpose other than to identify prospective properties which such consumers may have a good faith interest in purchasing or leasing. MLS Property Information Network, Inc. and its subscribers disclaim any and all representations and warranties as to the accuracy of the property listing data and information set forth herein. The MLS listing information displayed is deemed reliable, but is not guaranteed accurate by the MLS.