

Editorial Integrity
Making sound real estate investment decisions begins with reliable, data-driven insights. At Ziffy.ai, we offer an AI-native real estate investing, proprietary data-driven trend analysis, investment mortgage programs like DSCR loans, and a network of over 500 investor-friendly real estate agents to deliver the expertise needed for informed decisions. Our content is crafted by experienced real estate professionals and backed by real-time market data, ensuring you receive accurate and actionable information. Through a rigorous editorial process, we strive to empower your investment journey with trustworthy and up-to-date guidance.
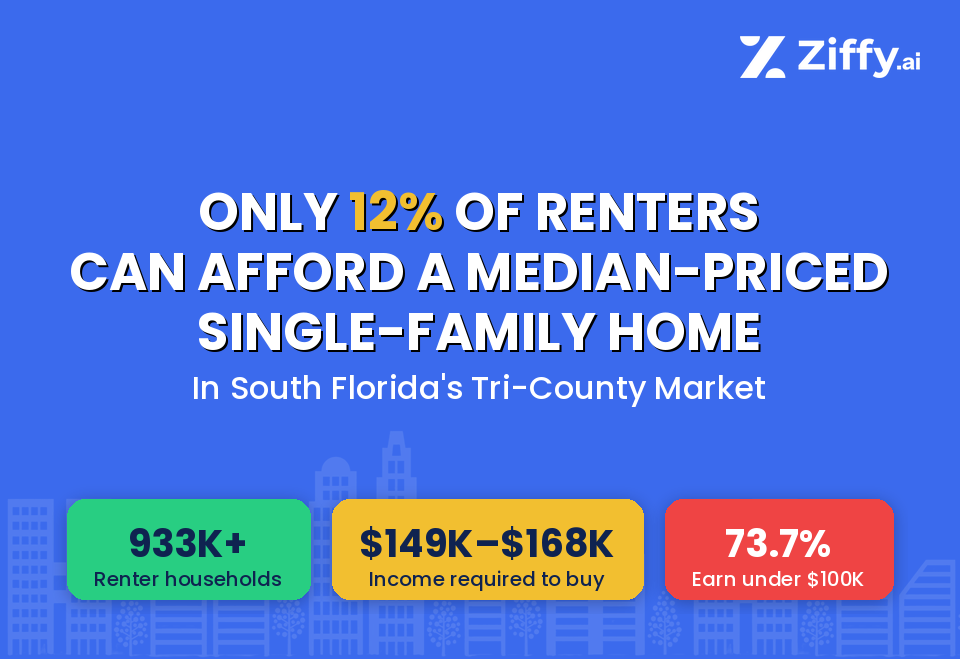
Across South Florida’s tri-county region, the income required to purchase a median-priced single-family home now ranges from $149,000 to $168,000, a threshold that fewer than 1 in 8 renter households can meet.
In Miami-Dade, Broward, and Palm Beach counties, 73.7% of renter households earn under $100,000, well below qualifying range. The 12% affordability figure represents an upper bound, actual qualification rates are likely lower once credit profiles, debt, and savings are factored in.
Even within the condo and townhome segment, access varies sharply by county from 22% in Miami-Dade to 47% in Broward, making location a defining factor in who can transition to ownership. Because condo HOA fees are not modeled separately, actual condo affordability is likely lower than these estimates.
Table of Contents
Key Highlights
-
 More than 820,000 renter households across the tri-county region fall below the income needed to purchase a median-priced single-family home.
With 933,538 total renter households across Miami-Dade, Broward, and Palm Beach counties, roughly 7 in 8 do not earn enough to qualify under standard lending assumptions.
- A renter household earning $100,000 still falls $49,000-$68,000 short of what is needed to buy a single-family home.
Required incomes range from $149,000 in Broward to $168,000 in Miami-Dade, placing single-family ownership out of reach even for households well above the regional median. - Condo required income differs by more than $43,000 depending on county, $67,000 in Broward versus $111,000 in Miami-Dade.
Despite serving the same regional market, entry-level ownership costs vary dramatically across county lines, making geography as important as income in determining access.
Where Homeownership Sits in the Renter Income Distribution
In the current South Florida housing market, the income required to purchase a home sits well above where most renters fall in the income distribution.
Across Miami-Dade, Broward, and Palm Beach counties, 73.7% of renter households earn under $100,000, while the income required to purchase a median-priced single-family home reaches as high as $168,000.
This places ownership thresholds firmly within the top income tier of renters, well beyond the range where most households are concentrated.
Income Band | % of Renter Households | % of Renters Below |
|---|---|---|
Under $50K | 41.9% | 41.9% |
$50K-$74K | 18.2% | 60.1% |
$75K-$99K | 13.6% | 73.7% |
$100K-$149K | 14.2% | 87.9% |
$150K+ | 12.1% | 100% |
This distribution reveals a defining feature of the current market: as required incomes increase, they intersect with progressively smaller segments of the renter population.

Amresh Singh
Founder and CEOZiffy.ai
The impact of this threshold dynamic is significant. At an income level of around $100,000, approximately 26% of renters fall at or above that level.
However, when the threshold increases to $150,000, eligibility drops to just 12%, effectively cutting the potential buyer pool by more than half.
Rather than a gradual decline in affordability, the data shows a sharp drop-off once incomes fall below key thresholds, particularly the six-figure range.
As a result, access to homeownership is concentrated among higher-income households, while the majority of renters remain positioned below the levels required to qualify under current conditions.
Key Affordability Insights Across South Florida
1. Homeownership in South Florida now requires top-tier income, with single-family homes priced beyond the reach of roughly 88% of renters.
Across Miami-Dade, Broward, and Palm Beach counties, required incomes range from $149,000 to $168,000, placing eligibility almost entirely within the top 12% of renter households. This tight clustering across counties shows that affordability constraints are not isolated to one market; rising Florida home prices have pushed ownership thresholds firmly into high-income territory across the region.
2. Miami-Dade is the least accessible housing market in the region, with the highest income barriers across both property types.
Required income reaches approximately $168,000 for single-family homes and $111,000 for condos and townhomes, pushing ownership well beyond the reach of most renter households. Even six-figure earners face limited access, particularly in the single-family segment.
3. Access to entry-level homeownership varies dramatically by county, with a gap of nearly 25 percentage points between markets
Condo and townhome affordability ranges from approximately 22% of renters in Miami-Dade to 47% in Broward, with Palm Beach in between. This variation shows that affordability is heavily location-dependent rather than consistent across the region.
4. The income required to purchase an entry-level home varies by more than $40,000 across counties.
Required income ranges from roughly $67,000 in Broward to $111,000 in Miami-Dade, highlighting how local pricing differences shape access to ownership. For renters near qualification thresholds, this gap can determine whether ownership is achievable or out of reach.
5. More than 30% of renters fall just below ownership thresholds in lower-cost markets, creating a large “near-miss” segment whose access depends on county.
Households earning between $50,000 and $99,000 represent a significant portion of the renter population and sit close to qualifying levels in markets like Broward, where the condo threshold ($67K) falls within their income range. In higher-cost counties, however, the same households fall well short-Miami-Dade’s $111K condo threshold sits $36,000 or more above where most of this group earns.

Debjit Saha
Co-Founder and CTOZiffy.ai
6. Broward County offers the most accessible entry point into homeownership in South Florida.
Housing in Broward County offers the lowest entry point, with required income of approximately $67,000 for condos and townhomes, nearly half of renter households can qualify. Lower home prices in this segment expand access relative to neighboring counties.
7. Palm Beach County represents a middle-ground market, with moderate affordability but still limited access.
In the West Palm Beach housing market, the required income sits around $82,000, with approximately 39% of renters able to qualify. While more accessible than Miami-Dade, the majority of households remain below ownership thresholds.
8. Differences in affordability across counties are driven primarily by home prices, not renter incomes.
Income distributions are broadly similar across the tri-county region, among income bands above $50,000, variation between counties does not exceed 3 percentage points. Even across all bands, the widest gap is roughly 4 percentage points, far too narrow to explain the large differences in affordability across counties. Those differences are largely driven by housing costs rather than by significant variation in what renters earn.
Required Income and Affordability by County and Property Type
The table below consolidates the income required to purchase a median-priced home across South Florida’s tri-county region and the estimated share of renters who meet those thresholds under the standardized assumptions outlined in the methodology.
County | Property Type | Median Price | Required Income | Income Threshold Band | % of Renters |
|---|---|---|---|---|---|
Miami-Dade | Single-Family | $674,000 | $168K | $150K+ | 12% |
Miami-Dade | Condo/Townhome | $445,000 | $111K | $100K-$149K | 22% |
Broward | Single-Family | $600,000 | $149K | $100K-$149K | 11% |
Broward | Condo/Townhome | $269,700 | $67K | $50K-$74K | 47% |
Palm Beach | Single-Family | $645,000 | $160K | $150K+ | 13% |
Palm Beach | Condo/Townhome | $330,000 | $82K | $75K-$99K | 39% |
Single-family required incomes cluster tightly between $149,000 and $168,000, with affordability ranging from 11% to 13% across counties. The condo and townhome segment shows wider variation from $67,000 required income and 47% affordability in Broward to $111,000 and 22% in Miami-Dade, making it the segment where county-level differences most directly shape access.
Where Affordability Breaks for Middle-Income Renters
The sharpest affordability constraints are felt by the roughly 297,000 middle-income renter households earning between $50,000 and $99,000, a group that makes up nearly one-third of the tri-county renter population.
Despite sitting well above the regional income floor, none of these households earn enough to qualify for a single-family home in any county. Their only potential path to ownership runs through the condo and townhome market and even there, access depends almost entirely on location.
Income Band | Households | Share of Renters | Broward Condo ($67K) | Palm Beach Condo ($82K) | Miami-Dade Condo ($111K) | Any Single-Family |
|---|---|---|---|---|---|---|
$50K-$74K |
| 18.2% | Partial | No | No | No |
$75K-$99K | 126,658 | 13.6% | Yes | Partial | No | No |
$100K-$149K | 132,436 | 14.2% | Yes | Yes | Partial | No |
A household earning $75,000 qualifies for a median-priced condo in Broward but falls short in Palm Beach and is roughly $36,000 below the Miami-Dade condo threshold, sitting roughly $36,000 higher. For those earning $50,000-$74,000, only a fraction can access the lowest-priced market, Broward and nothing else.
At $100,000-$149,000, condo access opens up across all three counties, but single-family homes remain out of reach, with even the lowest threshold (Broward, $149,000) sitting at the very top of the band.
Below this group, the picture is even starker. The 391,000 households earning under $50,000, the single largest segment at 41.9% of all renters, fall below qualifying thresholds for every property type in every county.
The result is a market where middle-income renters are not uniformly priced out, but are instead sorted by geography. The same household income that qualifies for ownership in one county falls short in the next, making where someone lives as consequential as what they earn.
Methodology
Data sources
- Renter household income distribution is drawn from the U.S. Census Bureau’s 2024 American Community Survey (ACS) 1-Year Estimates Detailed Table B25118, Tenure by Household Income in the Past 12 Months (in 2024 Inflation-Adjusted Dollars), using renter-occupied household income bands for Miami-Dade, Broward, and Palm Beach counties.
- Median sale prices for single-family homes and townhouses/condominiums are sourced from MIAMI REALTORS March 2026 county market summaries and details. The analysis uses March 2026 county-level median sale prices of $674,000 for Miami-Dade single-family homes and $445,000 for Miami-Dade townhouses/condominiums, $600,000 for Broward single-family homes and $269,700 for Broward townhouses/condominiums, and $645,000 for Palm Beach single-family homes and $330,000 for Palm Beach townhouses/condominiums.
- Mortgage-rate assumptions are based on Freddie Mac’s Primary Mortgage Market Survey (PMMS). The base case uses a 6.33% 30-year fixed mortgage rate, reflecting mid-April 2026 PMMS readings, which ranged from 6.30% to 6.37% for the weeks ending April 9-16, 2026.
Mortgage Assumptions
Affordability calculations are based on standardized mortgage assumptions:
- Interest rate: 6.33% (30-year fixed)
- Down payment: 20%, reflecting a conventional financing baseline and avoiding private mortgage insurance
- Debt-to-income ratio (DTI): 30%, used as a standardized affordability benchmark for total housing cost
- Property tax and insurance: estimated at 1.5% of home value annually as a standardized carrying-cost assumption
- Loan term: 30 years
These assumptions are applied uniformly across all counties and property types for comparability. Buyers can model different scenarios using Ziffy’s DSCR loan calculator to estimate qualification thresholds based on rental income rather than personal income.
Required Income Calculation
Required income is derived by estimating total monthly housing cost and applying the report’s 30% housing-cost-to-income affordability threshold.
Total monthly housing cost includes:
- monthly principal and interest, based on the mortgage rate and 30-year loan term
- estimated monthly property tax and insurance
Required annual income is calculated as:
Required Annual Income = (Total Monthly Housing Cost ÷ DTI) × 12
This reflects the annual gross income needed for housing costs to remain within 30% of income.
Affordability Calculation
Affordability is measured as the share of renter households whose income meets or exceeds the required income threshold. Each county’s affordability estimate is calculated against that county’s own renter income distribution, not the tri-county aggregate.
For each property type:
- income bands fully above the threshold are counted as fully eligible
- income bands fully below the threshold are counted as ineligible
- the band in which the threshold falls is treated as partially eligible
Partial eligibility within the boundary band is estimated using a uniform-within-band assumption, equivalent to a linear interpolation across that band’s income range.
For example, if the required income is $110,000 and the threshold falls within the $100,000-$149,999 band, the eligible share of that band is estimated as:
($150,000 − $110,000) ÷ ($150,000 − $100,000) = 80%
This assumes households are distributed evenly across the income range within that band. For the open-ended $150,000+ band, a $1,000,000 upper bound is assumed for interpolation purposes. The choice of upper bound has minimal impact on results, varying it between $500,000 and $2,000,000 shifts affordability estimates by less than 0.5 percentage points.
Limitations
- ACS income data is reported in grouped ranges, which do not capture within-band variation.
- Within-band affordability is estimated assuming a uniform distribution, which may not reflect actual income clustering.
- ACS income data reflects 2024 household incomes (in 2024 inflation-adjusted dollars), while home prices reflect March 2026 median sale prices. To the extent that incomes have risen over this period, the analysis may modestly overstate the affordability gap.
- Median sale price is used as a proxy for a typical market entry point and does not represent the lowest-priced available inventory.
- Borrower-specific factors such as credit score, existing debt, liquid savings, and lender overlays are not modeled.
- Mortgage assumptions are standardized; actual loan terms vary by borrower and lender.
- Condominium HOA fees, which can materially affect affordability, are not modeled separately.
- The 20% down payment assumption reflects a conventional lending baseline; lower down payment programs may reduce upfront cash requirements but can introduce mortgage insurance costs that are not captured here.
Notes
- Affordability estimates are based on standardized assumptions and are intended for comparability across counties and property types.
- Actual borrower qualification may vary based on credit profile, debt obligations, HOA fees, insurance costs, lender overlays, and available savings. This analysis reflects modeled affordability under the assumptions stated in the methodology and does not forecast future market conditions.
- Comparable data for additional markets and geographies is available upon request at contact@ziffy.ai
About Ziffy
Ziffy.ai is an all-in-one, AI-native real estate investment platform designed to help investors discover, analyze, and finance U.S. real estate opportunities.
The platform combines AI-native property search with detailed investment analysis on every listing, including rental income potential, cash flow, and return metrics. Ziffy also provides access to specialized financing solutions such as DSCR loans, fix-and-flip loans, and bridge loans, enabling investors to evaluate and execute opportunities in one place.