


Editorial Integrity
Making sound real estate investment decisions begins with reliable, data-driven insights. At Ziffy.ai, we offer an AI-native real estate investing, proprietary data-driven trend analysis, investment mortgage programs like DSCR loans, and a network of over 500 investor-friendly real estate agents to deliver the expertise needed for informed decisions. Our content is crafted by experienced real estate professionals and backed by real-time market data, ensuring you receive accurate and actionable information. Through a rigorous editorial process, we strive to empower your investment journey with trustworthy and up-to-date guidance.
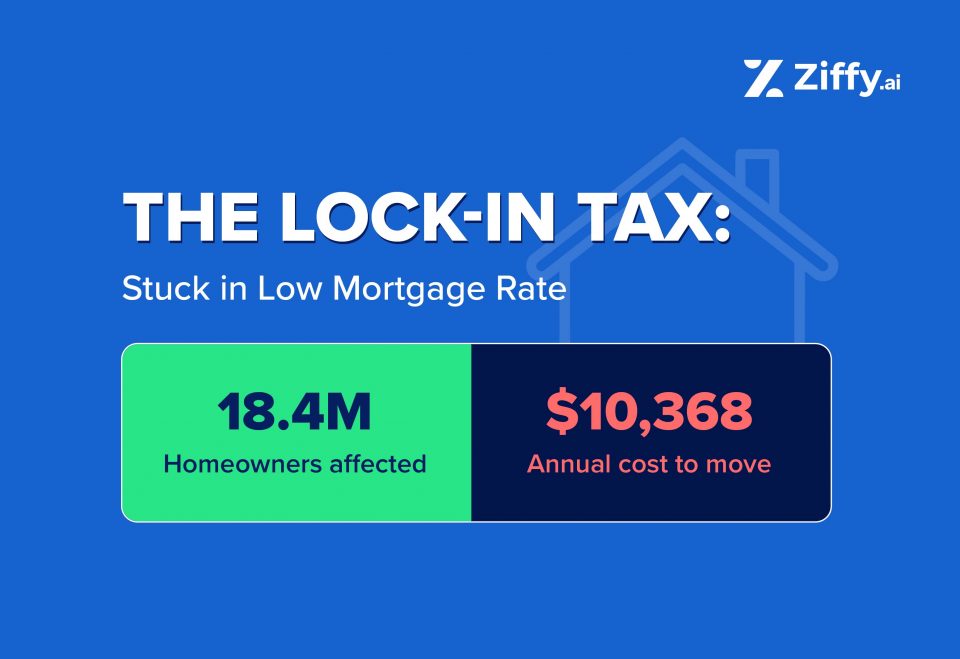
More than 18.4 million U.S. mortgage borrowers, over a third of all outstanding loans, hold rates below 3.5%, creating a material financial barrier to moving, as 30-year rates remain above 6%.
At today’s rates, these borrowers face a rate gap of nearly 3 percentage points or more, well past the roughly 1.5 percentage point threshold at which research suggests monthly payment increases become a material deterrent to moving.
Most secured these rates during 2020-2021 and have been effectively locked in since borrowing costs surged in mid-2022.
On a illustrative $405,000 loan, the gap between a 2.8% pandemic-era rate and today’s 6.38% rate translates to an additional $864 per month, $10,368 more per year, to carry an equivalent mortgage elsewhere. That payment gap is the mechanism behind what this analysis calls the Lock-In Tax.
That gap doesn’t just cost money, it changes behavior. FHFA research finds that mortgage rate lock-in has prevented an estimated 1.72 million home sales through Q2 2024, tightening supply and limiting market turnover.
Applying Census Bureau mobility data and the Federal Reserve’s conservative estimate of lock-in’s contribution to reduced household movement, this analysis estimates that approximately 73,000 moves per year continue to be suppressed.
Data current as of March 2026. Mortgage stock count: FHFA NMDB Q1 2024. Rate distribution: FHFA NMDB Q3 2025. Current rate: Freddie Mac PMMS, March 26, 2026.
Key Highlights
-
 18.4 Million U.S. Borrowers Are Locked In Below 3.5%, Over a Third of All Outstanding Mortgages.
More than 18.4 million mortgage borrowers, over a third of all outstanding loans, hold rates below 3.5%, creating a material financial barrier to moving. On a typical $405,000 mortgage, switching to today’s 6.38% rate raises monthly payments by $864, an additional $10,368 annually. - Lock-in has persisted for nearly four years, with no clear exit.
Many borrowers have faced a severe rate gap since mid-2022, when mortgage rates surged above 5%. With rates still at 6.38% as of March 2026, this constraint has lasted nearly four years, turning what was expected to be temporary into a structural feature of the housing market. - 1.72 Million Home Sales Prevented, and an Estimated 73,000 Moves Suppressed Each Year.
FHFA research estimates lock-in has prevented 1.72 million home sales through Q2 2024, tightening supply and limiting market turnover. Applying Census Bureau mobility data and the Federal Reserve’s conservative estimate of lock-in’s contribution to reduced household movement, this analysis estimates that approximately 73,000 moves per year continue to be suppressed, roughly 4% of the FHFA’s broader figure.
How a Third of U.S. Mortgage Borrowers Are Locked into Ultra-Low Rates
36.3% of all mortgages
Free to move without rate gap
More than 18.4 million mortgage borrowers, over a third of all outstanding loans, hold rates below 3.5%, placing them at the center of the lock-in effect.
This estimate combines FHFA mortgage stock and rate distribution data from different periods and should be interpreted as an approximation rather than a point-in-time count.
These borrowers secured ultra-low rates during 2020-2021 and now face the steepest financial penalties to move as mortgage rates remain above 6%.
In total, 78.8% of mortgage borrowers hold rates below 6%, and an additional share within the 6%+ bucket holds rates between 6.0% and today’s 6.38%, meaning nearly 4 in 5, and likely more, would face higher payments if they moved, even if not all are severely locked in.
Rate Bucket | % of Loans | Estimated Mortgages | Rate Gap vs 6.38% | Lock-In Severity |
|---|---|---|---|---|
Below 3.0% | 20.0% | 10.2M | 3.88pp | Highest rate gap |
3.0%-3.49% | 16.3% | 8.3M | 3.13pp | Very high rate gap |
Below 3.5% (subtotal) | 36.3% | 18.4M | – | Primary focus |
3.5%-3.99% | 15.2% | 7.7M | 2.63pp | High rate gap |
4.0%-4.99% | 17.1% | 8.7M | 1.88pp | Moderate rate gap |
5.0%-5.99% | 10.2% | 5.2M | 0.88pp | Low rate gap |
6.0% and above | 21.2% | 10.8M | – | No rate gap |
Note: Rate gap categories reflect the difference between borrowers’ existing mortgage rates and the current 6.38% market rate. These categories are illustrative and based on rate gap magnitude rather than borrower-specific financial circumstances.
What It Costs to Move: The Payment Gap by Mortgage Rate
On a illustrative $405,000 mortgage, a borrower holding a 2.8% rate, representative of pandemic-era refinance rates, would pay $864 more per month at today’s 6.38% rate, or $10,368 more per year.
Borrowers at the very lowest rates, closer to 2.5%, face monthly increases of $928, or roughly $11,136 annually. Separately, Freddie Mac estimates a $47,800 present-value lock-in cost per conventional borrower, a lifetime figure reflecting the cumulative financial trade-off of moving, conceptually distinct from the annual payment penalty above.
Borrower Rate | Rate Gap vs 6.38% | Monthly Increase | Annual Increase | 30-Year Cost of Moving |
|---|---|---|---|---|
2.5% | 3.88pp | $928 | $11,136 | $334,080 |
2.8% | 3.58pp | $864 | $10,368 | $311,040 |
3.0% | 3.38pp | $821 | $9,852 | $295,560 |
3.5% | 2.88pp | $709 | $8,508 | $255,240 |
4.0% | 2.38pp | $594 | $7,128 | $213,840 |
5.0% | 1.38pp | $354 | $4,248 | $127,440 |
Note: Figures reflect principal and interest only and exclude taxes, insurance, and transaction costs.
The monthly payment figures and the nominal lifetime penalty assume no prepayment. The $47,800 Freddie Mac figure is a separate present-value estimate, not nominal, and is not comparable to the payment figures above.
Borrowers with the lowest pandemic-era rates have faced this constraint since mid-2022, when rates first crossed 5%, a penalty now nearly four years old.
The typical locked-in borrower
Where the cost turns severe
Meaningful but manageable
Borrowers with rates between 2.5% and 3.0% face an additional $9,852 to $11,136 per year if they move today, helping explain why many households are choosing to stay put despite changing housing needs.
Note: Assumes a $405,000 loan at a 30-year fixed rate. Current rate: 6.38% (Freddie Mac PMMS, March 2026). Monthly figures rounded to the nearest dollar; annual and 30-year figures calculated from rounded monthly values.
What Lock-In is Doing to Mobility and Housing Supply
FHFA research estimates that mortgage rate lock-in has prevented an estimated 1.72 million home sales through Q2 2024, up from 1.33 million through Q4 2023, tightening supply and limiting market turnover. That supply constraint has been associated with home prices running 5.7% to 7.0% higher than they otherwise would have been.
boom peaks
mobility begins sharp decline
mobility, 320K fewer moves
The pattern is visible in the data. As 30-year fixed rates fell to a historic low of 2.96% in 2021, homeowner mobility briefly rose. When rates surged past 5% in mid-2022, mobility reversed sharply, dropping from 6.4% to 5.5% among mortgage holders, and reaching a record low in 2024 as 320,000 fewer Borrowers moved compared to the prior year.
Federal Reserve research finds that lock-in explains approximately 44% of the decline in moves among mortgage holders between 2021 and 2023. This is the conservative end of a range supported by multiple independent studies.
Applying that conservative 44% attribution to Census Bureau mobility data, this analysis estimates that approximately 73,000 household moves per year continue to be suppressed, a fraction of the FHFA’s broader finding that 1.72 million cumulative home sales were prevented between Q2 2022 and Q2 2024, consistent with our narrower focus on the most deeply locked-in borrowers.
Estimated impact: 73,000 moves suppressed each year
Applying the Federal Reserve’s mobility attribution to the locked-in population, the following calculation produces an estimate of the annual suppression effect:
below 3.5%
(6.4% → 5.5%)
lock-in (conservative)
moves per year
Note: This figure is derived from Federal Reserve and Census data and should be interpreted as directional rather than a directly observed count. It suggests tens of thousands of household moves per year may not be occurring, including some moves tied to job opportunities or changing housing needs.
The Economic Ripple Effect: What Locked-In Borrowers Are Missing
This is an illustrative scenario, not a measured macroeconomic estimate.
Each suppressed move carries an economic cost. Atlanta Fed Wage Tracker data shows that workers who switch jobs earn a median 1.1 percentage points more in annual wage growth than those who stay, a premium worth approximately $683 per year on a median income of $62,088.
For the estimated 73,000 moves suppressed annually, that translates to tens of millions of dollars in aggregate forgone income. This analysis uses the conservative $683 figure rather than the broader $8,867 household earnings gain reported by LendingTree and Census LEHD data, which captures a different and wider economic effect.
coincided with lock-in activation
briefly overtook switchers mid-2025
The chart reveals a development that compounds the lock-in story. The switcher-stayer premium peaked at 2.2 percentage points in 2022, the same year lock-in activated, and has since narrowed sharply. By mid-2025, job stayers were earning higher wage growth than switchers for the first time since 2010. Locked-in borrowers are being prevented from moving during a period when the premium for moving is itself shrinking, suggesting the window of highest opportunity cost may already be closing.
Separately, peer-reviewed research from Fonseca and Liu (Journal of Finance, 2024) finds that locked-in borrowers are approximately 50% less responsive to nearby wage growth opportunities. This is not just about moves that don’t happen, it is about a dampening of the labor market’s ability to allocate workers to their most productive use.
Income Evidence: What a Suppressed Move Costs
Source | Value per Move | What It Measures |
|---|---|---|
Atlanta Fed | $683 | Individual wage premium for job-switchers vs. |
LendingTree / | $8,867 | Total household earnings gain for workers |
Freddie Mac | $47,800 | Lifetime present-value cost of lock-in per conventional borrower |
Note on measures: The $683 and $8,867 figures are annual flow measures, they represent income forgone each year a move doesn’t happen. The $47,800 Freddie Mac figure is a lifetime present-value stock measure, the total financial cost of holding a below-market rate over the remaining loan term. These are conceptually distinct and should not be directly compared.

Debjit Saha
Co-Founder and CTOZiffy.ai
How Long Have Borrowers Been Locked In?
Mortgage lock-in began to take hold in 2022, when rates rose sharply from pandemic-era lows, creating a meaningful financial barrier to moving for millions of borrowers. The table below traces the rate history that produced this constraint.
Year | Average Rate | Market Context |
|---|---|---|
2019 | 3.94% | Pre-pandemic baseline |
2020 | 3.11% | Rates decline amid economic shock |
2021 | 2.96% | Record lows; peak refinancing activity |
2022 | 5.34% | Sharp rate increase; lock-in activates mid-year |
2023 | 6.81% | Lock-in entrenched; mobility declines |
2024 | 6.72% | Elevated rates persist |
2025 | 6.60% | Full-year average (Freddie Mac) |
2026 (March) | 6.38% | Current – still well above pandemic-era levels |
Source: Freddie Mac Primary Mortgage Market Survey (PMMS). 2025 full-year average as reported by Freddie Mac Chief Economist Sam Khater, December 2025.
When the lock-In effect took hold
As a rough heuristic, borrowers begin to experience meaningful lock-in when current mortgage rates exceed their existing rate by roughly 1.5 percentage points, the point at which higher monthly payments become a significant deterrent to moving. This threshold is indicative rather than fixed, and varies by household.
Lock-in onset defined as the quarter in which the prevailing mortgage rate exceeded the cohort’s rate by 1.5 percentage points, a rough heuristic, not a fixed threshold. Duration calculated to March 2026.
Borrower Cohort | Approx. Threshold | Lock-In began | Estimated Duration |
|---|---|---|---|
Below 3.0% (10.2M borrowers) | 4.5% | Q2 2022 | 3.75 years |
3.0% – 3.49% (8.3M borrowers) | 4.75% | Q2 2022 | 3.75 years |
3.5% – 3.99% (7.7M borrowers) | 5.25% | Q3 2022 | 3.5 years |
Nearly four years, and still ongoing – For borrowers with pandemic-era mortgages below 3.5%, the lock-in effect has now persisted for nearly four years, with current mortgage rates still far above the levels at which these loans were originated. Without a meaningful decline in rates, this constraint is likely to continue.
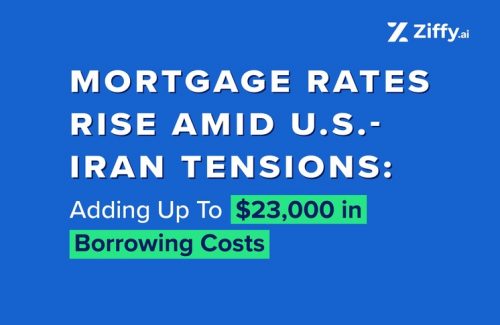
And the constraint remains vulnerable to further shocks. When bond market volatility amid U.S.-Iran tensions briefly pushed rates higher in March 2026, the additional borrowing cost reached as high as $23,000 per loan, a reminder that lock-in can deepen as quickly as it formed.

Amresh Singh
Founder and CEOZiffy.ai
A typical locked-in borrower: what moving costs in practice
To illustrate the real-world impact of mortgage lock-in, consider a borrower who refinanced during the pandemic rate trough. This example is hypothetical but grounded in observed market conditions and published data.
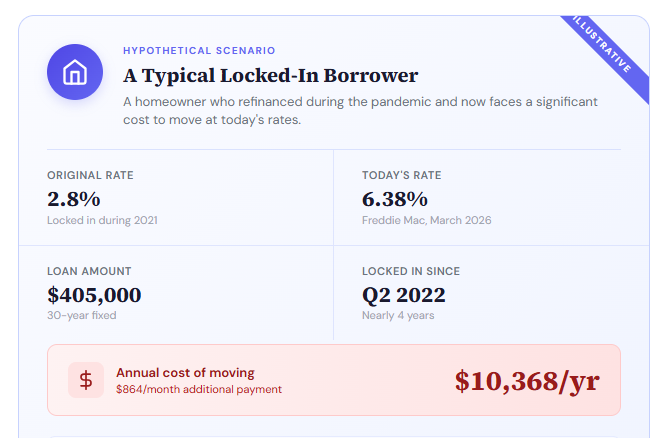
Note: This scenario is illustrative, not a reported finding. The $10,368 annual figure is a nominal payment difference, it does not account for equity, tax implications, or changes in home value. The Freddie Mac lifetime present-value lock-in cost of $47,800 per borrower is a conceptually distinct measure calculated over the remaining loan term.
Lock-in by the Numbers
The following figures summarize the key findings from this analysis, drawing on Federal Reserve, FHFA, Freddie Mac, and Census data.
1. An estimated 18.4 million U.S. mortgage borrowers are locked into rates below 3.5%, far below today’s 6.38% market rate.
Based on FHFA mortgage counts and rate distribution, roughly one in three borrowers holds an ultra-low pandemic-era rate. With current mortgage rates more than 2.8 percentage points higher, a large share of borrowers faces a significant payment gap if they choose to move.
2. A typical borrower moving from a 2.8% mortgage to today’s rates would pay $864 more per month, $10,368 more per year.
On a $405,000 30-year fixed mortgage at 6.38%, monthly payments rise by $864, or $10,368 more per year, compared to pandemic-era rates. This payment gap represents the primary financial barrier preventing many borrowers from listing their homes.
3. Borrowers with rates near 2.5% face monthly payment increases of $928 if they move today.
The lowest-rate borrowers, many of whom refinanced in 2020-2021, experience the largest gap between their existing rate and current market rates. These borrowers face some of the strongest financial disincentives to move in the modern history of the U.S. housing market.
4. Only 21% of mortgage borrowers hold rates at or above today’s 6.38%, the rest face some degree of lock-in.
FHFA data shows that the vast majority of borrowers originated loans at rates well below current levels. As a result, most mortgage holders would need to accept a meaningfully higher interest rate if they sold and purchased another home, reinforcing low housing turnover across the market.
5. Mortgage lock-in is associated with an estimated 1.72 million fewer U.S. home sales through Q2 2024.
FHFA research finds that higher mortgage rates have significantly reduced the likelihood that borrowers with low-rate mortgages will sell, contributing to a measurable decline in housing turnover nationwide.
6. Lock-in is associated with roughly a 7% increase in home prices by restricting available inventory.
By discouraging existing borrowers from selling, the lock-in effect limits supply. FHFA estimates this supply constraint is associated with home prices running approximately 7% higher than they otherwise would have been through Q2 2024.
7. Mortgage lock-in explains approximately 44% of the decline in homeowner mobility observed between 2021 and 2023.
Federal Reserve research finds that rising mortgage rates played a significant role in reducing homeowner moves during this period, particularly among borrowers with fixed-rate mortgages.
8. Applying Census Bureau mobility data and the Federal Reserve’s conservative 44% attribution estimate, this analysis estimates that approximately 73,000 household moves per year may be suppressed.
This figure should be interpreted as directional, an illustrative estimate derived from published research rather than a directly observed count.
Methodology
1. Estimating the locked-in population
The locked-in population is estimated using the FHFA National Mortgage Database (NMDB). Total outstanding mortgages: 50.8 million (Q1 2024). Share below 3.5%: 36.3% (Q3 2025). This yields approximately 18.4 million mortgage borrowers with the strongest lock-in exposure.
The stock count and rate distribution are drawn from different NMDB vintages, Q1 2024 and Q3 2025 respectively. Quarterly erosion of approximately 300,000 mortgages through refinancing and payoffs implies roughly 1% drift over 18 months, which is within rounding tolerance and does not materially affect the estimate.
Mortgage borrowers refers to outstanding mortgage count; household-level duplication is not observable in this dataset and is not modeled.
2. Estimating the mobility impact
Homeowner mobility rates are sourced from the U.S. Census American Community Survey, declining from 6.4% in 2019 to 5.5% in 2023, a 0.9 percentage point absolute drop.
Two peer-reviewed estimates of lock-in’s contribution to this decline exist in the literature. The Federal Reserve Board (Aladangady et al., FEDS 2024-088) attributes 44% of the mobility decline among mortgage holders to lock-in. FHFA (Batzer et al., WP 24-03) attributes 57%, measured as the share of fixed-rate mortgage sales suppressed.
These figures are not interchangeable, they measure different outcomes over different periods using different methodologies. This analysis uses only the Federal Reserve’s 44% figure as the conservative anchor, reducing the risk of overstating the suppression effect.
Estimated suppressed moves are calculated as:
Locked-in population × observed mobility decline × 44% attribution = 18,440,400 × 0.009 × 0.44 = approximately 73,000 per year
This is a derived estimate, not a direct observation. It should be interpreted as directional, indicative of the scale of suppression rather than a precise annual count.
3. Income impact (illustrative)
To illustrate the potential earnings dimension of reduced mobility, the Atlanta Fed Wage Growth Tracker (February 2026) is used. Job-switchers experience median wage growth of 4.7% against 3.6% for job-stayers, a 1.1 percentage point premium.
Applied to the median individual wage of $62,088 (BLS Current Population Survey, Q1 2025), this produces an estimated $683 in additional annual income per move.
Two income figures exist in the research literature. The Atlanta Fed figure ($683) measures the individual wage premium for job-switchers versus job-stayers. A separate LEHD-based figure ($8,867) measures household earnings gains for workers who both switched jobs and relocated, a narrower, higher-earning population subset.
These two figures measure different things and cannot be averaged or presented as a range. This analysis uses only the conservative Atlanta Fed figure.
Applied to the 73,000 suppressed moves estimate, the illustrative annual income effect is approximately $50 million ($683 × 73,000 = approximately $49.9 million). This assumption overstates the true effect, since not all suppressed moves would have been job-related, not all job-related moves require relocation, and not every job switch produces the median premium, which has itself varied over time. The figure should be interpreted as an upper-bound thought experiment, not a measured macroeconomic effect.
The main findings section references the aggregate effect as “tens of millions of dollars annually” rather than the precise figure, reflecting this uncertainty.
4. FHFA sales impact estimates
FHFA Working Paper 24-03 provides two estimates, reflecting different dataset vintages covering different time periods. These are presented separately throughout this analysis and are never blended:
Original dataset (through Q4 2023): 1.33 million prevented sales; 5.7% associated home price effect.
Updated dataset (through Q2 2024): 1.72 million prevented sales; 7.0% associated home price effect.
These estimates measure home sales suppression, a related but distinct outcome from the mobility suppression measured by the Federal Reserve.
5. Payment Gap Calculations
Monthly payment figures are calculated using standard amortization on a $405,000 loan balance over a 30-year term at the stated rates.
The $405,000 loan balance is an illustrative figure approximating the median balance for recent conventional originations, not a population statistic.
The primary illustrative scenario uses 2.8% as the borrower rate, representative of rates available during the 2020-2021 refinancing window, against today’s 6.38% (Freddie Mac PMMS, March 2026), producing a $864 monthly increase and $10,368 annual increase.
Lifetime figures ($311,040 for the primary scenario) are nominal, undiscounted, and assume no prepayment. Monthly figures are rounded to the nearest dollar; annual and 30-year figures are calculated from rounded monthly values. Present-value costs would be lower depending on the discount rate applied.
The $47,800 Freddie Mac welfare cost (January 2025 Chart Book, based on December 2024 data) is a present-value lifetime estimate for conventional borrowers. It is conceptually distinct from the annual payment gap and is never presented in the same figure or sentence as the annual $10,368 figure without explicit methodology separation.
Data Sources
1. FHFA National Mortgage Database (NMDB)
Mortgage stock count (50.8 million outstanding mortgages, Q1 2024) and rate distribution by bucket (Q3 2025). Primary source for the locked-in population estimate. Published by the Federal Housing Finance Agency.
2. Freddie Mac Primary Mortgage Market Survey (PMMS)
30-year fixed mortgage rate history, 2019 through March 2026. Current rate: 6.38% (March 2026). 2025 full-year average: 6.60%, as reported by Freddie Mac Chief Economist Sam Khater, December 2025.
3. Freddie Mac Economic Research
Per-borrower present-value lock-in welfare cost estimate: $47,800 (December 2024 data, published January 2025 Chart Book). Applies to conventional borrowers. Lifetime present-value figure, not an annual measure.
4. Federal Reserve Board – FEDS 2024
Aladangady et al. Attributes approximately 44% of the post-pandemic mobility decline among mortgage holders to lock-in. Primary source for mobility attribution used in the suppressed moves calculation.
5. FHFA Working Paper
Batzer et al. Two dataset vintages used and presented separately: 1.33 million prevented sales and 5.7% price effect (through Q4 2023); 1.72 million prevented sales and 7.0% price effect (through Q2 2024). Also cited for the 57% fixed-rate mortgage sales suppression figure, which was considered but not used in the primary mobility estimate.
6. U.S. Census Bureau – American Community Survey (ACS)
Homeowner mobility rates: 6.4% (2019 pre-pandemic baseline) and 5.5% (2023). Source for the 0.9 percentage point mobility decline used in the suppressed moves calculation.
7. Fonseca & Liu – Journal of Finance, December 2024
Finds that locked-in borrowers are significantly less responsive to nearby wage growth than mobile borrowers. Cited as supporting evidence for the labor market dimension of lock-in and not used in quantitative calculations.
8. Atlanta Fed Wage Growth Tracker- February 2026
Job-switcher median wage growth: 4.7%. Job-stayer median wage growth: 3.6%. Premium: 1.1 percentage points. Applied to median individual wage of $62,088 to produce the $683 per-move income estimate used in the economic ripple effect section.
Notes
- This analysis estimates the scale of mortgage rate lock-in’s effect on U.S. household mobility and labor market participation using publicly available federal data and peer-reviewed research. The “Lock-In Tax” is an editorial framework developed by Ziffy.ai, it is not an actual tax imposed by any government entity. Temporal proximity between rate changes and mobility trends should not be interpreted as definitive causation.
- Full underlying data tables are included with the report, and calculations and source files are available upon request at contact@ziffy.ai
About Ziffy
Ziffy.ai is the first AI-native, fully integrated all-in-one real estate investing platform that helps investors in the US discover, analyze, finance, and buy properties in one place. It combines intelligent property search, real-time ROI insights, and investor-focused mortgage programs to make investing simpler and smarter.