





Editorial Integrity
Making sound real estate investment decisions begins with reliable, data-driven insights. At Ziffy.ai, we offer an AI-native real estate investing, proprietary data-driven trend analysis, investment mortgage programs like DSCR loans, and a network of over 500 investor-friendly real estate agents to deliver the expertise needed for informed decisions. Our content is crafted by experienced real estate professionals and backed by real-time market data, ensuring you receive accurate and actionable information. Through a rigorous editorial process, we strive to empower your investment journey with trustworthy and up-to-date guidance.
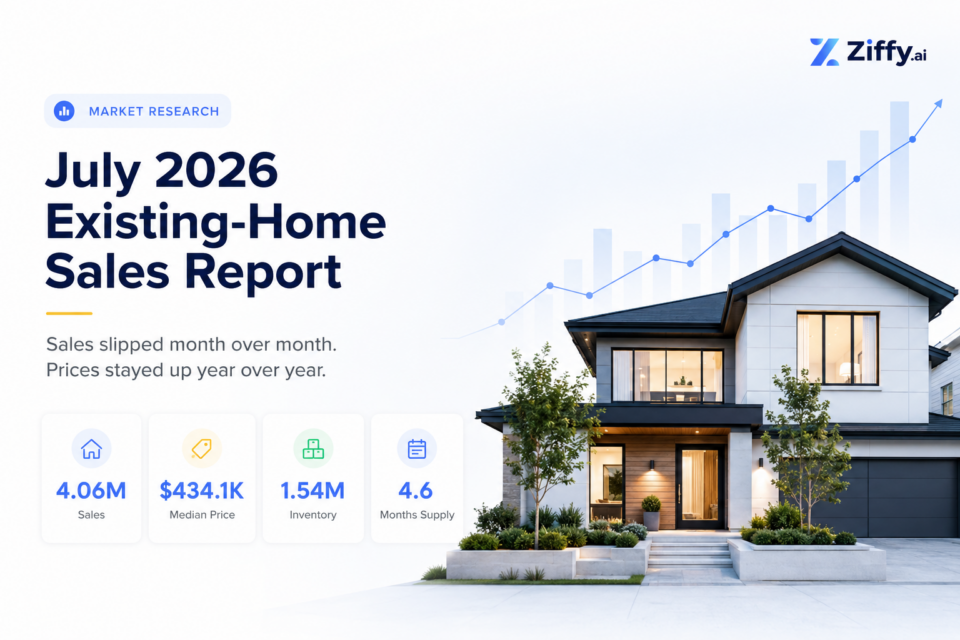
The July housing report looks quiet at first glance. Existing-home sales slipped from June, inventory barely moved, and prices continued climbing.
For real estate investors, though, the national headline hides a much more divided market.
Sales of homes below $250,000 declined from a year earlier, while transactions above $500,000 increased sharply. The Midwest remained relatively affordable, the Northeast recorded the strongest annual price growth, and almost half of existing-home sales still took place in the South. Meanwhile, cash buyers remained active even as NAR’s combined investor and second-home buyer share fell from last year’s level.
That combination makes July less of a “housing slowdown” story and more of a market-selection story.
Table of Contents
July 2026 Existing-Home Sales: The Numbers at a Glance
| Housing Market Metric | July 2026 | Change |
|---|---|---|
| Existing-home sales | 4.06 million SAAR | -1.7% MoM, +0.7% YoY |
| Median existing-home price | $434,100 | +2.0% YoY |
| Total housing inventory | 1.54 million | -1.9% MoM, -0.6% YoY |
| Months of supply | 4.6 months | Unchanged YoY |
| Median days on market | 29 days | 28 days in July 2025 |
| Cash sales | 26% of sales | 31% in July 2025 |
| Individual investors/second-home buyers | 14% | 20% in July 2025 |
| First-time buyers | 29% | 28% in July 2025 |
The combination is unusual enough to deserve a closer look: fewer homes sold than in June, fewer homes were available for sale, yet the typical transaction still occurred at a higher price than a year ago.
Why Did Existing-Home Sales Fall While Home Prices Rose?
A decline in sales does not automatically mean falling home values.
July illustrates the difference between transaction volume and pricing. Sales volume fell from June, but national inventory also declined. With 4.6 months of supply unchanged from both June and July 2025, buyers did not suddenly gain access to a large pool of unsold properties.
The distribution of sales by price adds another clue.
NAR’s July supplemental existing-home sales data show the following year-over-year changes for existing single-family homes:
NAR does not attribute the national median-price increase solely to a change in transaction mix. Still, the pattern is consistent with a market in which higher-priced transactions are holding up better than lower-priced ones.
That distinction is especially useful for investors. Weak sales at the lower end can reflect affordability pressure, limited inventory, or both. It should not automatically be read as disappearing demand.
In our separate analysis of starter-home inventory across 855 US housing markets, 42 markets had no active house or townhome listings below $300,000 in the December 23, 2025 snapshot, while 55 had fewer than 1% of listings below that threshold. The July NAR data now show that closed sales are also weakest in the lowest price bands.
For an investor searching for inexpensive rentals, the constraint may be the availability of viable properties at the intended basis rather than a lack of competing buyers.
Housing Inventory and Months of Supply: Do Buyers Have More Negotiating Power?
July’s 4.6 months of supply does not support a simple national “buyer’s market” label. Inventory was actually down 1.9% from June and 0.6% from a year earlier.
There are signs of a slower transaction environment. Homes took a median 29 days to sell, compared with 28 days in June and 28 days a year ago. The change is small, but it sits alongside declining monthly sales rather than a renewed rush of demand.
Investors can use that slower pace selectively. A property that has accumulated days on market, needs repairs, carries unusually high operating costs, or sits in a softer local submarket may offer considerably more negotiating room than the national inventory figure suggests.
The reverse is also true. Low-priced properties in supply-constrained neighborhoods can remain competitive even when national sales are declining.
Regional Housing Market Trends: Midwest Affordability, Southern Volume, and Coastal Prices
The regional split is one of the strongest investor signals in July.
| Region | MoM Sales | YoY Sales | Median Price | YoY Price Change |
|---|---|---|---|---|
| Northeast | +2.0% | 0.0% | $563,800 | +5.2% |
| Midwest | -2.0% | +2.1% | $342,900 | +2.8% |
| South | -3.1% | 0.0% | $371,700 | +0.9% |
| West | 0.0% | +1.4% | $622,200 | +0.2% |
Midwest: The Lowest Entry Price of the Four Regions
At $342,900, the Midwest had the lowest regional median price. It was also one of only two regions where sales increased year over year. NAR’s supplemental data show especially strong annual sales growth in the Midwest above $500,000, including a 23.8% increase in the $1 million-plus segment.
For rental investors, lower acquisition prices can help financing and cash-flow math, but metro-level rent, vacancy, property taxes and employment trends still decide whether a particular market works.
South: Still the Largest Share of Existing-Home Sales
The South accounted for 46% of July existing-home sales, far ahead of the Midwest at 24%, West at 18% and Northeast at 12%. Yet Southern sales fell 3.1% from June, the largest monthly decline among the four regions. Its median price increased just 0.9% year over year.
For investors already targeting Sun Belt markets, that combination warrants property-level analysis instead of assuming the entire region is moving together.
West and Northeast: Higher Entry Costs Remain a Major Filter
The West’s median price reached $622,200, while the Northeast stood at $563,800. The Northeast recorded the strongest annual price growth at 5.2%. The West, by comparison, saw just 0.2% annual appreciation.
There are pockets of lower-priced activity even in the West. Sales between $100,000 and $250,000 increased 15.9% year over year, but that price bracket represented only 4.7% of Western transactions in NAR’s sample.
That is a useful reminder that a large percentage increase can describe a relatively small slice of a regional market.
Cash Sales and Investor Activity: Who Is Competing for Homes?
Cash remained a large part of the market in July, accounting for 26% of transactions, up from 25% in June but below 31% a year earlier.
NAR also reported that individual investors or second-home buyers represented 14% of sales, up from 13% in June and down from 20% in July 2025. That category combines two buyer groups, so the 14% figure should not be described as a pure real estate investor market share.
Alongside those figures, the Census Bureau reported a 65.0% national homeownership rate and 7.3% rental vacancy ratein the second quarter of 2026. Neither rate changed significantly from a year earlier.
For rental investors, the national vacancy figure is best treated as context rather than a rent-demand assumption. Local vacancy, achievable rent, property type and neighborhood-level supply belong in the actual underwriting.
Mortgage Rates and DSCR Loans: Financing Can Change an Investment Deal Quickly
Mortgage rates remain one of the biggest constraints on acquisition math.
NAR reported an average 30-year fixed mortgage rate of 6.54% in July, compared with 6.49% in June and 6.72% a year earlier. By August 13, Freddie Mac’s Primary Mortgage Market Survey put the weekly 30-year average at 6.67%.
Those conventional mortgage averages are not DSCR loan quotes, but they show the broader rate environment investors are operating in.
For a rental financed with a DSCR loan, the full payment is especially important because we calculate:
DSCR = Gross Monthly Rent ÷ PITIA
PITIA includes principal, interest, taxes, insurance and association dues. At Ziffy Mortgage, we offer eligible DSCR purchases up to 85% LTV, with a minimum 620 credit score, loan amounts from $100,000 to $10 million and two months of reserves. Eligible properties below a 1.0 DSCR may also have a path through No-Ratio DSCR financing.
That distinction becomes particularly relevant in a market where purchase prices remain high. A lower negotiated price can improve the deal, but taxes, insurance, HOA dues and the final loan structure still determine whether the rental income adequately covers PITIA.
Investors can run a property through our DSCR Loan Calculator, Rental Property ROI Calculator and Cap Rate Calculator before committing to an offer.
Properties requiring significant rehabilitation call for a different financing analysis.
A property needing substantial work may fit fix and flip financing during renovation and transition to DSCR financing if the investor later stabilizes and holds it as a rental.
Pending Home Sales and Housing Starts: What Could Happen Next?
Two reports released after the July existing-home sales data add useful forward-looking context.
NAR’s Pending Home Sales Index fell 2.3% in July to 71.2, with monthly contract activity declining in all four US regions. Pending sales generally lead closed existing-home sales by one or two months, so the July decline suggests that near-term transaction volume could remain restrained.
New construction sent a mixed supply signal. The US Census Bureau’s July New Residential Construction report showed housing starts falling 12.4% from June to a 1.239 million annual rate. Building permits, however, increased 5.0% to 1.443 million, including a 2.5% monthly increase in single-family permits.
That does not point to an immediate surge in housing supply. It does give investors another reason to follow local construction pipelines alongside existing-home inventory.
What Should Real Estate Investors Take From the July Housing Market?
July’s NAR data do not support one nationwide investment call. The better approach is to narrow the market in layers.
Start with the region and metro, then look at the price band in which you will actually buy. Compare current inventory and days on market with recent sales rather than assuming a national slowdown guarantees a discount.
For rental properties, verify achievable rent and build PITIA using current tax information, insurance quotes and HOA costs. A property that only works with optimistic rent or incomplete expenses is already starting with very little room.
For value-add properties, decide the exit before deciding the financing. A short-term renovation loan and a long-term DSCR loan solve different stages of an investment.
Most importantly, do not confuse fewer transactions with cheaper real estate. July produced fewer sales than June while prices still increased from a year earlier. The opportunities are increasingly concentrated in specific markets, price bands and individual properties rather than spread evenly across the US housing market.
FAQs
Is the US Housing Market a Buyer’s Market in 2026?
The July national data do not support a broad buyer’s-market label. Inventory represented 4.6 months of supply, unchanged from June and from a year earlier. Conditions can differ substantially by metro, neighborhood and price range.
Which US Region Had the Lowest Median Home Price in July?
The Midwest had the lowest regional existing-home price at $342,900, followed by the South at $371,700, Northeast at $563,800 and West at $622,200.
Are Real Estate Investors Buying Fewer Homes?
NAR’s combined category for individual investors and second-home buyers represented 14% of July sales, compared with 20% a year earlier. Because NAR groups investors and second-home buyers together in this measure, the data cannot be used to calculate a standalone investor share.
How Do Higher Mortgage Rates Affect DSCR Investors?
A higher interest rate generally increases principal-and-interest payments, which raises PITIA if other inputs remain unchanged. Since we calculate DSCR as gross monthly rent divided by PITIA, a higher payment can reduce the property’s DSCR. Investors should therefore evaluate purchase price, leverage, taxes, insurance, HOA dues and rent together rather than screening a property on rent alone.