Save Search
Filters Applied
EditEdit Filters
Price: $300K - 500K
Monthly Cash Flow: $1 - $3k+
Home Type: Single Family
Investment Properties for Sale in Bolingbrook, IL
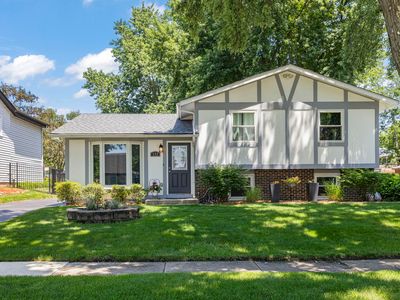
Listed for sale 1 day ago
$ 350,000
ROI
26.9
Cash Flow/m
 692
692- 3 Bed
- 2 Bath
- 1314 sft
122 Grady Dr, Bolingbrook, IL, 60440
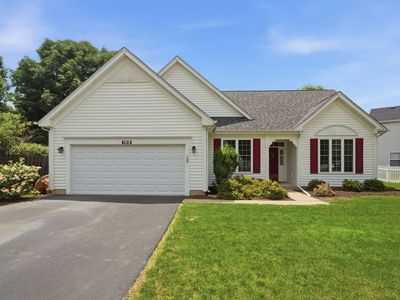
Listed for sale 1 day ago
$ 365,000
ROI
25.5Cash Flow/m
588- 3 Bed
- 2 Bath
- 1363 sft
169 Sandalwood Ln, Bolingbrook, IL, 60440
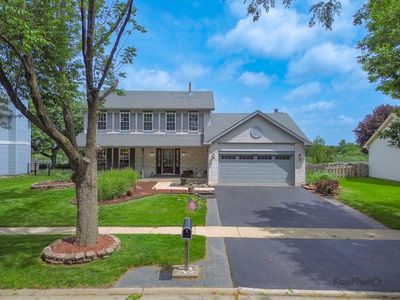
Listed for sale 1 day ago
$ 399,000
ROI
24.2Cash Flow/m
495- 3 Bed
- 3 Bath
- 2835 sft
1450 Parkside Dr, Bolingbrook, IL, 60490
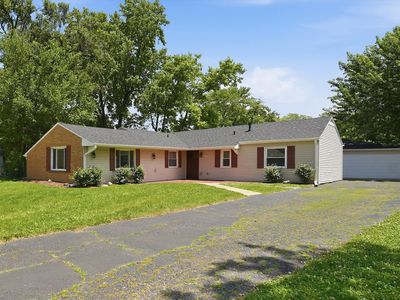
Listed for sale 1 day ago
$ 359,900
ROI
26.0Cash Flow/m
624- 3 Bed
- 2 Bath
- 1772 sft
113 Parklawn Ct, Bolingbrook, IL, 60440
Why Invest in Bolingbrook, Illinois?
Bolingbrook, IL offers strong investment potential with steady home value appreciation around 3-6% annually. Rental yields average 6-7% driven by proximity to Chicago and growing renter demand. Cap rates hover at 5-6% with average rents near $2,500 monthly. Cash flow remains positive at $300-400 per unit amid stable employment. Investor interest is rising due to Illinois' projected 3.4% median price growth in 2026.
8.5%
Avg. ROI
6.8%
Rental Yield
5.7%
Cap Rate
$350/mo
Avg. Cash Flow
$2566/mo
Avg. Rent
4.2%
1Y Appreciation
Frequently Asked Questions
Average rental yield in Bolingbrook is around 6.8% based on current market rents of $2,566 monthly. This supports positive cash flow for investors. Yields vary by property type and location within the city.
Find Your Perfect Investment Property in Bolingbrook, Illinois
Explore investment opportunities by strategy, performance, or property type
