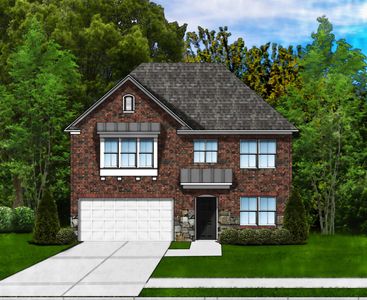
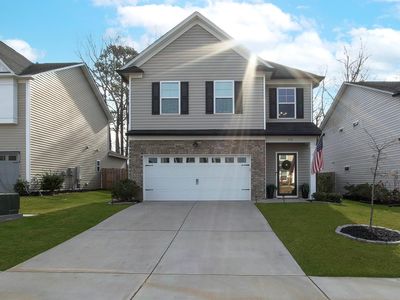
Porter II Plan, Crystal Springs LakeLexingtonSC29073
INVESTMENT ANALYSIS
Investment Verdict
Strong Cash FlowFew Lexington rentals match the income profile of Porter II Plan, Crystal Springs Lake, Lexington, SC, 29073. Listed at $314,900, gross rent is $2,970/mo and net cash flow is $1,095/mo, a 11.32% yield well above national averages. DSCR 2.10 means Ziffy Mortgage can approve your loan on the property's income alone, bypassing personal income verification. The 5% annual appreciation trend adds $87,001 by year five with $2,900/yr in annual principal reduction, projecting $189,589 in total cumulative return.
| This Property | City Avg | |
|---|---|---|
| Gross Rental Yield | 11.3% | 6.8% |
| Monthly Cash Flow | $1,095 | $850 |
City averages based on Lexington market data in our database. Property projections are estimates.
DSCR Rental Loan Qualification
Qualifies using the property's rental income, not your personal income.
- ✓No W-2, pay stubs, or tax returns needed
- ✓Rental income qualifies you
- ✓Built for real estate investors
| Monthly Rental Income | $2,970 |
| Total Monthly Debt Service | $1,749 |
| DSCR Ratio | 1.70x |
Ziffy Mortgage: Your DSCR most likely meets our 1.0+ requirement, so you'll most probably qualify for our standard DSCR investment loan program. To pre-qualify, book time with your loan officer →
Estimates assume 6.0% rate / 30-yr fixed, 30% down, 1% tax, 0.5% insurance. Not a commitment to lend.
Single Family
Built in 2025
N/A lot
$N/A/sqft
No HOA
Neighborhood Data
Neighborhood data shown for ZIP Code: 29073, Lexington, SC area.
Housing Distribution
Housing Statistics
| Category | Value |
|---|---|
| Total HU (Housing Units) | 21,366 (100%) |
| Owner Occupied HU | 17,189 (80.5%) |
| Renter Occupied HU | 2,899 (13.6%) |
| Vacant Housing Units | 1,278 ( 6.0%) |
| Median Home Value | $239,149 |
| Average Home Value | $263,127 |
Housing Distribution
Address Breakdown
Residential
21,069
Single Family
20,814
Multi-Family
255
Businesses
883


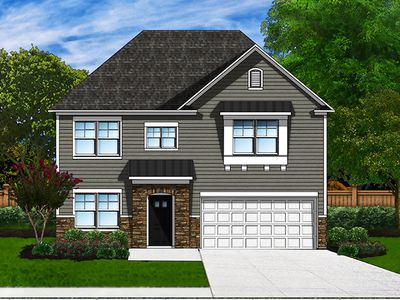
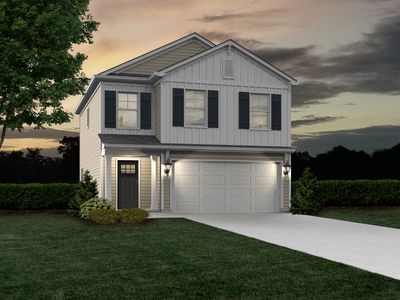
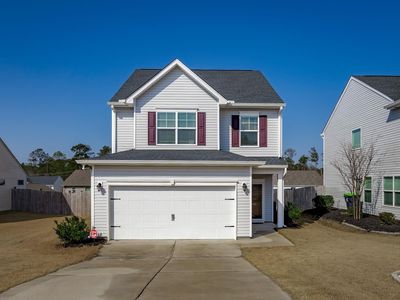
Nearby investment properties with comparable rents


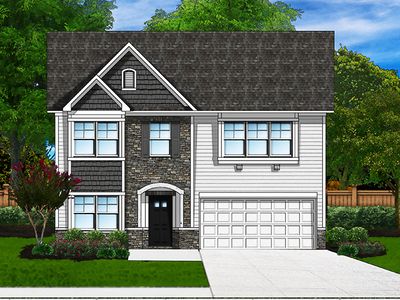
Nearby investment properties with comparable prices

Ziffy AI Summary
A quick, investor-focused snapshot highlighting income strength, yield potential.
| Key metrics | Value |
|---|---|
| Price | $399,900 |
| Est. Rent | $3,200/mo |
| ROI | 18% |
- Attractive rent-to-price ratio for income stability
- Good fit for DSCR financing with healthy coverage
Single Family
Built in 2025
N/A lot
$N/A/sqft
No HOA
Neighborhood Data
Neighborhood data shown for ZIP Code: 29073, Lexington, SC area.
Housing Distribution
Housing Statistics
| Category | Value |
|---|---|
| Total HU (Housing Units) | 21,366 (100%) |
| Owner Occupied HU | 17,189 (80.5%) |
| Renter Occupied HU | 2,899 (13.6%) |
| Vacant Housing Units | 1,278 ( 6.0%) |
| Median Home Value | $239,149 |
| Average Home Value | $263,127 |
Housing Distribution
Address Breakdown
Residential
21,069
Single Family
20,814
Multi-Family
255
Businesses
883
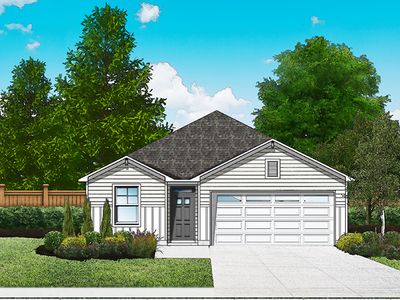
Nearby investment properties with comparable rents
Nearby investment properties with comparable prices
Listed by: Bryan Owens • Great Southern Homes
Mls Name: Great Southern Homes
Mls Provider:
Mls ID: #N/A