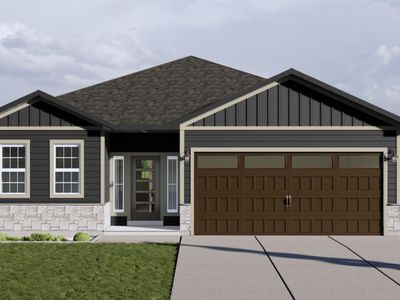
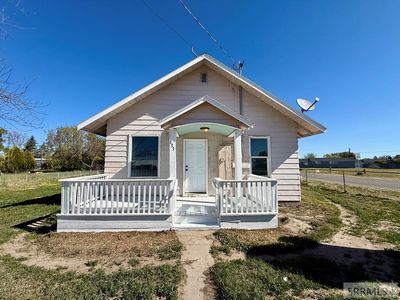
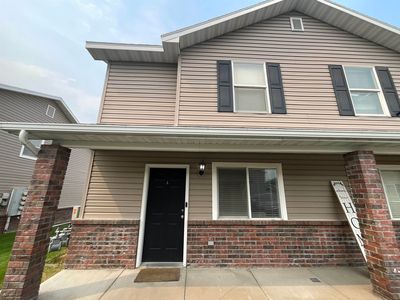
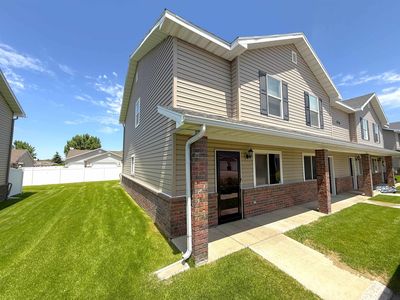
Oakridge Plan, Harris EstatesBlackfootID83221
INVESTMENT ANALYSIS
Investment Verdict
Solid IncomeReliable, bankable, and well-priced, Oakridge Plan, Harris Estates, Blackfoot, ID, 83221 in Blackfoot delivers $1,943/mo in gross rent and $505/mo in net monthly income at a $249,999 entry. The 9.33% yield and 1.73 DSCR make it a clean candidate for Ziffy Mortgage's DSCR loan; no W-2s or U.S. credit history required. With 5% annual appreciation projecting $69,070 over five years and $2,303/yr in equity from loan paydown, total projected return is $126,841.
| This Property | City Avg | |
|---|---|---|
| Gross Rental Yield | 9.3% | 6.0% |
| Monthly Cash Flow | $505 | $300 |
City averages based on Blackfoot market data in our database. Property projections are estimates.
DSCR Rental Loan Qualification
Qualifies using the property's rental income, not your personal income.
- ✓No W-2, pay stubs, or tax returns needed
- ✓Rental income qualifies you
- ✓Built for real estate investors
| Monthly Rental Income | $1,943 |
| Total Monthly Debt Service | $1,339 |
| DSCR Ratio | 1.45x |
Ziffy Mortgage: Your DSCR most likely meets our 1.0+ requirement, so you'll most probably qualify for our standard DSCR investment loan program. To pre-qualify, book time with your loan officer →
Estimates assume 6.0% rate / 30-yr fixed, 30% down, 1% tax, 0.5% insurance. Not a commitment to lend.
Single Family
Built in 2024
N/A lot
$N/A/sqft
No HOA
Neighborhood Data
Neighborhood data shown for ZIP Code: 83221, Blackfoot, ID area.
Housing Distribution
Housing Statistics
| Category | Value |
|---|---|
| Total HU (Housing Units) | 10,394 (100%) |
| Owner Occupied HU | 7,575 (72.9%) |
| Renter Occupied HU | 2,322 (22.3%) |
| Vacant Housing Units | 497 ( 4.8%) |
| Median Home Value | $333,604 |
| Average Home Value | $369,076 |
Housing Distribution
Address Breakdown
Residential
9,808
Single Family
9,744
Multi-Family
64
Businesses
734


Nearby investment properties with comparable rents
Nearby investment properties with comparable prices


Ziffy AI Summary
A quick, investor-focused snapshot highlighting income strength, yield potential.
| Key metrics | Value |
|---|---|
| Price | $399,900 |
| Est. Rent | $3,200/mo |
| ROI | 18% |
- Attractive rent-to-price ratio for income stability
- Good fit for DSCR financing with healthy coverage
Single Family
Built in 2024
N/A lot
$N/A/sqft
No HOA
Neighborhood Data
Neighborhood data shown for ZIP Code: 83221, Blackfoot, ID area.
Housing Distribution
Housing Statistics
| Category | Value |
|---|---|
| Total HU (Housing Units) | 10,394 (100%) |
| Owner Occupied HU | 7,575 (72.9%) |
| Renter Occupied HU | 2,322 (22.3%) |
| Vacant Housing Units | 497 ( 4.8%) |
| Median Home Value | $333,604 |
| Average Home Value | $369,076 |
Housing Distribution
Address Breakdown
Residential
9,808
Single Family
9,744
Multi-Family
64
Businesses
734
Nearby investment properties with comparable rents
Nearby investment properties with comparable prices