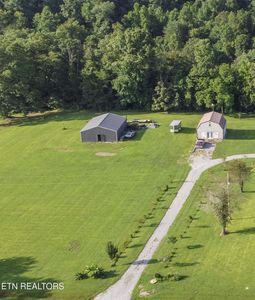
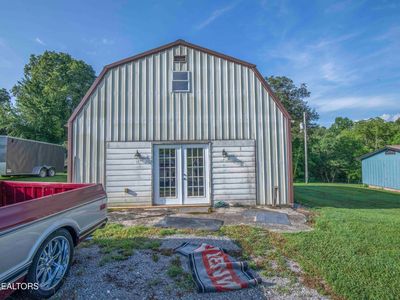
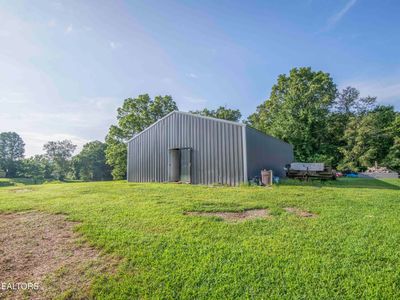
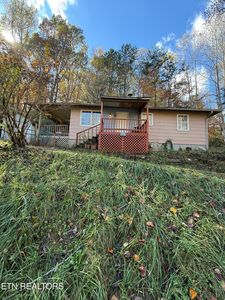
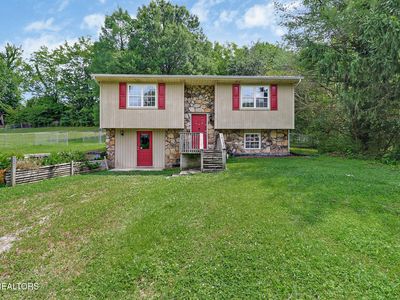
Nydeck RdRobbinsTN37852
INVESTMENT ANALYSIS
Investment Verdict
Appreciation PlayNydeck Rd, Robbins, TN, 37852 in Robbins is priced for appreciation, not yield. Rental yield 0%. At $169,000 with a 0% gross yield, the monthly income is modest, but 5% annual price growth is projected to add $46,692 in value over five years, making equity the primary return driver. Ziffy Mortgage's DSCR mortgage (0.00) can still finance this property for non-U.S. residents; a 30–35% down payment typically produces the cleanest underwriting for appreciation-focused assets.
| This Property | National Avg | |
|---|---|---|
| Gross Rental Yield | 0% | 6.2% |
| Monthly Cash Flow | $0 | $180 |
National averages based on 2024–2025 U.S. residential rental market data. Content is user-generated and unverified.
Single Family
Built in 1990
4.50 Acres lot
$N/A/sqft
No HOA
Neighborhood Data
Neighborhood data shown for ZIP Code: 37852, Robbins, TN area.
Housing Distribution
Housing Statistics
| Category | Value |
|---|---|
| Total HU (Housing Units) | 1,335 (100%) |
| Owner Occupied HU | 937 (70.2%) |
| Renter Occupied HU | 221 (16.6%) |
| Vacant Housing Units | 177 (13.3%) |
| Median Home Value | $126,974 |
| Average Home Value | $173,218 |
Housing Distribution
Address Breakdown
Residential
1,116
Single Family
1,115
Multi-Family
1
Businesses
30


Nearby investment properties with comparable rents
No similar rental properties found nearby.
Nearby investment properties with comparable prices

Ziffy AI Summary
A quick, investor-focused snapshot highlighting income strength, yield potential.
| Key metrics | Value |
|---|---|
| Price | $399,900 |
| Est. Rent | $3,200/mo |
| ROI | 18% |
- Attractive rent-to-price ratio for income stability
- Good fit for DSCR financing with healthy coverage
Single Family
Built in 1990
4.50 Acres lot
$N/A/sqft
No HOA
Neighborhood Data
Neighborhood data shown for ZIP Code: 37852, Robbins, TN area.
Housing Distribution
Housing Statistics
| Category | Value |
|---|---|
| Total HU (Housing Units) | 1,335 (100%) |
| Owner Occupied HU | 937 (70.2%) |
| Renter Occupied HU | 221 (16.6%) |
| Vacant Housing Units | 177 (13.3%) |
| Median Home Value | $126,974 |
| Average Home Value | $173,218 |
Housing Distribution
Address Breakdown
Residential
1,116
Single Family
1,115
Multi-Family
1
Businesses
30
Nearby investment properties with comparable rents
No similar rental properties found nearby.
Nearby investment properties with comparable prices
Listed by: Darlene Dehart • ReMax First
Mls Name: East Tennessee Realtors
Mls Provider:
Mls ID: #1309317
Disclaimer: IDX information is provided exclusively for personal, non-commercial use, and may not be used for any purpose other than to identify prospective properties consumers may be interested in purchasing. Information is deemed reliable but not guaranteed. Listing Information presented by local MLS brokerage: Zillow, Inc., local broker - Hendrik Van Leesten - (865) 378-5282.