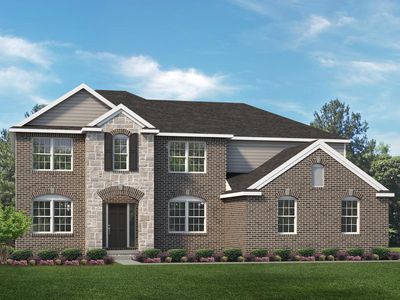
Hampton Plan, KinsleySuperior TownshipMI48105
INVESTMENT ANALYSIS
Investment Verdict
Appreciation PlayYield and appreciation often trade off, and at Hampton Plan, Kinsley, Superior Township, MI, 48105 in Superior Township the bet is firmly on appreciation. Rental yield 0%. The 0% gross yield on a $808,990 price is below income-first thresholds, but 5%/yr value growth projects $223,509 in equity by year five. Ziffy Mortgage's non-U.S. DSCR mortgage (0.00) finances the acquisition on rental income alone. A larger down payment (30–35%) reduces monthly debt service and tightens the spread.
| This Property | City Avg | |
|---|---|---|
| Gross Rental Yield | 0% | 7.8% |
| Monthly Cash Flow | $0 | $250 |
City averages based on Superior Township market data in our database. Property projections are estimates.
Single Family
Built in N/A
N/A lot
$N/A/sqft
No HOA
Neighborhood Data
Neighborhood data shown for ZIP Code: 48105, Ann Arbor, MI area.
Housing Distribution
Housing Statistics
| Category | Value |
|---|---|
| Total HU (Housing Units) | 17,988 (100%) |
| Owner Occupied HU | 8,288 (46.1%) |
| Renter Occupied HU | 8,515 (47.3%) |
| Vacant Housing Units | 1,185 ( 6.6%) |
| Median Home Value | $491,269 |
| Average Home Value | $578,441 |
Housing Distribution
Address Breakdown
Residential
17,208
Single Family
14,376
Multi-Family
2,832
Businesses
619


Nearby investment properties with comparable rents
No similar rental properties found nearby.
Nearby investment properties with comparable prices

Ziffy AI Summary
A quick, investor-focused snapshot highlighting income strength, yield potential.
| Key metrics | Value |
|---|---|
| Price | $399,900 |
| Est. Rent | $3,200/mo |
| ROI | 18% |
- Attractive rent-to-price ratio for income stability
- Good fit for DSCR financing with healthy coverage
Single Family
Built in N/A
N/A lot
$N/A/sqft
No HOA
Neighborhood Data
Neighborhood data shown for ZIP Code: 48105, Ann Arbor, MI area.
Housing Distribution
Housing Statistics
| Category | Value |
|---|---|
| Total HU (Housing Units) | 17,988 (100%) |
| Owner Occupied HU | 8,288 (46.1%) |
| Renter Occupied HU | 8,515 (47.3%) |
| Vacant Housing Units | 1,185 ( 6.6%) |
| Median Home Value | $491,269 |
| Average Home Value | $578,441 |
Housing Distribution
Address Breakdown
Residential
17,208
Single Family
14,376
Multi-Family
2,832
Businesses
619
Nearby investment properties with comparable rents
No similar rental properties found nearby.
Nearby investment properties with comparable prices
Listed by: N/A • N/A
Mls Name: undefined
Mls ID: #N/A