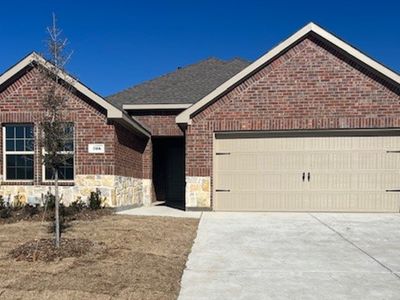
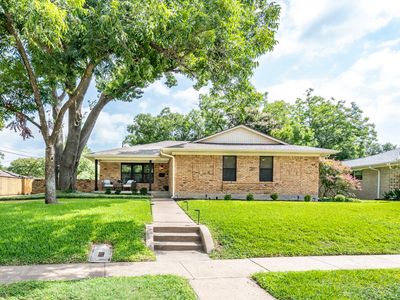
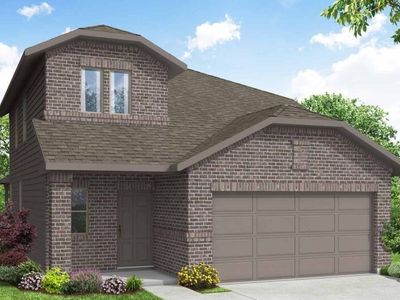
H158 Canyon Plan, Fireside by the LakeGarlandTX75043
INVESTMENT ANALYSIS
Investment Verdict
Strong Cash FlowThe yield at H158 Canyon Plan, Fireside by the Lake, Garland, TX, 75043 in Garland speaks for itself: 12.84% gross on a $421,990 price, generating $4,516/mo in rent and $1,515/mo in net income after the $1,898/mo debt service. DSCR 2.38, a wide margin that supports Ziffy Mortgage's DSCR loan without any personal income check. Annual cash flow of $18,177 stacks alongside $116,588 in projected five-year appreciation and $3,887/yr in principal reduction. Projected total cumulative return: $259,195.
| This Property | National Avg | |
|---|---|---|
| Gross Rental Yield | 12.8% | 6.2% |
| Monthly Cash Flow | $1,515 | $180 |
National averages based on 2024–2025 U.S. residential rental market data. Content is user-generated and unverified.
DSCR Rental Loan Qualification
Qualifies using the property's rental income, not your personal income.
- ✓No W-2, pay stubs, or tax returns needed
- ✓Rental income qualifies you
- ✓Built for real estate investors
| Monthly Rental Income | $4,516 |
| Total Monthly Debt Service | $2,833 |
| DSCR Ratio | 1.59x |
Ziffy Mortgage: Your DSCR most likely meets our 1.0+ requirement, so you'll most probably qualify for our standard DSCR investment loan program. To pre-qualify, book time with your loan officer →
Estimates assume 6.0% rate / 30-yr fixed, 30% down, 1% tax, 0.5% insurance. Not a commitment to lend.
Single Family
Built in 2024
N/A lot
$N/A/sqft
No HOA
Neighborhood Data
Neighborhood data shown for ZIP Code: 75043, Garland, TX area.
Housing Distribution
Housing Statistics
| Category | Value |
|---|---|
| Total HU (Housing Units) | 24,240 (100%) |
| Owner Occupied HU | 13,880 (57.3%) |
| Renter Occupied HU | 9,044 (37.3%) |
| Vacant Housing Units | 1,316 ( 5.4%) |
| Median Home Value | $296,591 |
| Average Home Value | $346,299 |
Housing Distribution
Address Breakdown
Residential
24,006
Single Family
17,774
Multi-Family
6,232
Businesses
849


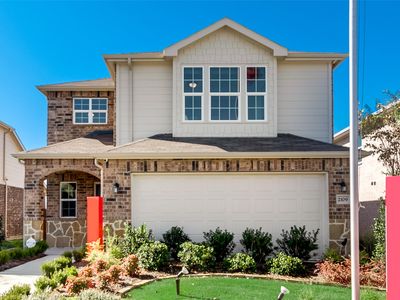
Nearby investment properties with comparable rents
Nearby investment properties with comparable prices

Ziffy AI Summary
A quick, investor-focused snapshot highlighting income strength, yield potential.
| Key metrics | Value |
|---|---|
| Price | $399,900 |
| Est. Rent | $3,200/mo |
| ROI | 18% |
- Attractive rent-to-price ratio for income stability
- Good fit for DSCR financing with healthy coverage
Single Family
Built in 2024
N/A lot
$N/A/sqft
No HOA
Neighborhood Data
Neighborhood data shown for ZIP Code: 75043, Garland, TX area.
Housing Distribution
Housing Statistics
| Category | Value |
|---|---|
| Total HU (Housing Units) | 24,240 (100%) |
| Owner Occupied HU | 13,880 (57.3%) |
| Renter Occupied HU | 9,044 (37.3%) |
| Vacant Housing Units | 1,316 ( 5.4%) |
| Median Home Value | $296,591 |
| Average Home Value | $346,299 |
Housing Distribution
Address Breakdown
Residential
24,006
Single Family
17,774
Multi-Family
6,232
Businesses
849
Nearby investment properties with comparable rents
Nearby investment properties with comparable prices