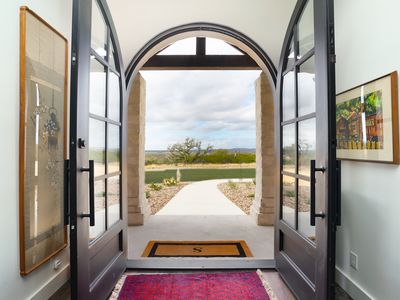
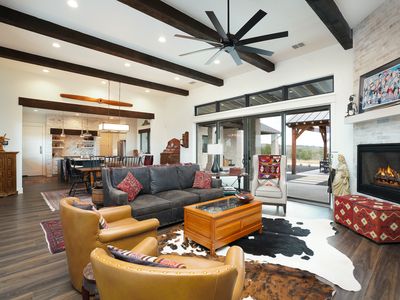
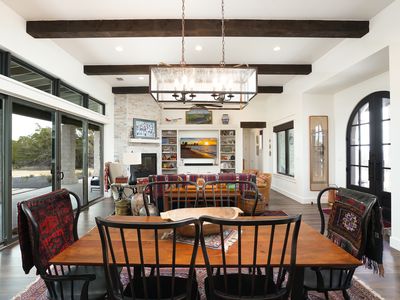
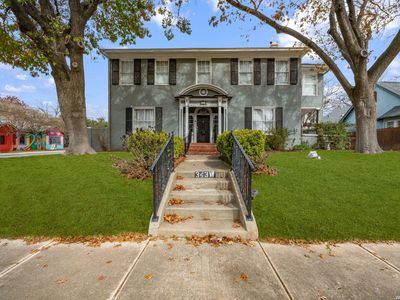
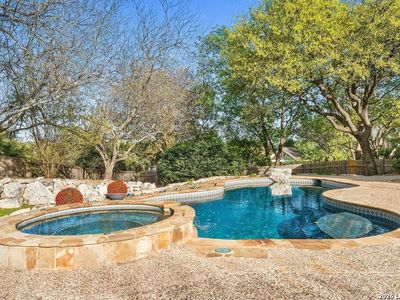
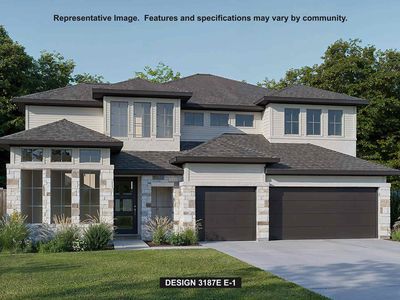
Fredericksburg Plan, Canyons at Scenic LoopSan AntonioTX78255
INVESTMENT ANALYSIS
Investment Verdict
Appreciation PlayThe investment thesis at Fredericksburg Plan, Canyons at Scenic Loop, San Antonio, TX, 78255 in San Antonio is capital appreciation. Rental yield 5.72%. The 5.72% gross yield at $893,000 falls below cash-flow thresholds, but 5% annual value growth is forecast to deliver $246,719 in additional equity by year five, an equity gain that can outpace many higher-yield markets. Ziffy Mortgage finances appreciation-play assets via DSCR (1.06) without U.S. credit history; structure with a larger down payment to optimise coverage. Total projected return: $207,414.
| This Property | City Avg | |
|---|---|---|
| Gross Rental Yield | 5.7% | 5.8% |
| Monthly Cash Flow | $(2,095) | $450 |
City averages based on San Antonio market data in our database. Property projections are estimates.
DSCR Rental Loan Qualification
Qualifies using the property's rental income, not your personal income.
- ✓No W-2, pay stubs, or tax returns needed
- ✓Rental income qualifies you
- ✓Built for real estate investors
| Monthly Rental Income | $4,255 |
| Total Monthly Debt Service | $5,995 |
| DSCR Ratio | 0.71x |
Ziffy Mortgage typically prefers a DSCR of 1.0+, but in some cases you may qualify with a DSCR below 1. To explore if this deal qualifies for an investment mortgage, book time with your loan officer →
Estimates assume 6.0% rate / 30-yr fixed, 30% down, 1% tax, 0.5% insurance. Not a commitment to lend.
Single Family
Built in 2026
N/A lot
$N/A/sqft
No HOA
Neighborhood Data
Neighborhood data shown for ZIP Code: 78255, San Antonio, TX area.
Housing Distribution
Housing Statistics
| Category | Value |
|---|---|
| Total HU (Housing Units) | 8,946 (100%) |
| Owner Occupied HU | 5,821 (65.1%) |
| Renter Occupied HU | 2,263 (25.3%) |
| Vacant Housing Units | 862 ( 9.6%) |
| Median Home Value | $490,774 |
| Average Home Value | $527,540 |
Housing Distribution
Address Breakdown
Residential
7,308
Single Family
6,526
Multi-Family
782
Businesses
95


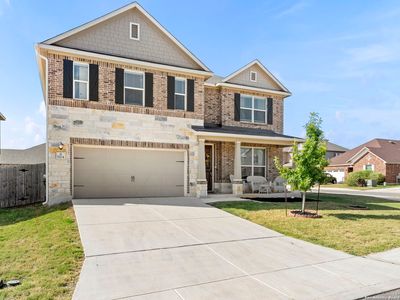
Nearby investment properties with comparable rents
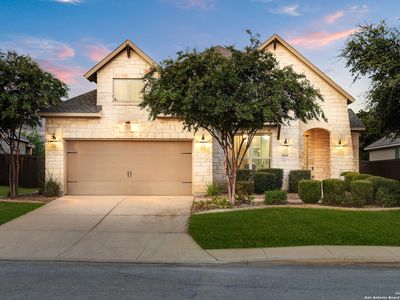
Nearby investment properties with comparable prices

Ziffy AI Summary
A quick, investor-focused snapshot highlighting income strength, yield potential.
| Key metrics | Value |
|---|---|
| Price | $399,900 |
| Est. Rent | $3,200/mo |
| ROI | 18% |
- Attractive rent-to-price ratio for income stability
- Good fit for DSCR financing with healthy coverage
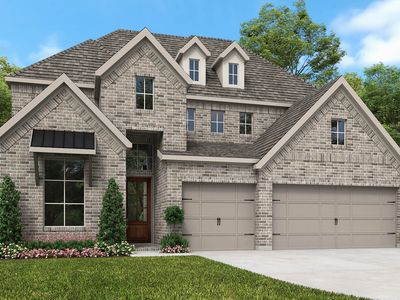
Single Family
Built in 2026
N/A lot
$N/A/sqft
No HOA
Neighborhood Data
Neighborhood data shown for ZIP Code: 78255, San Antonio, TX area.
Housing Distribution
Housing Statistics
| Category | Value |
|---|---|
| Total HU (Housing Units) | 8,946 (100%) |
| Owner Occupied HU | 5,821 (65.1%) |
| Renter Occupied HU | 2,263 (25.3%) |
| Vacant Housing Units | 862 ( 9.6%) |
| Median Home Value | $490,774 |
| Average Home Value | $527,540 |
Housing Distribution
Address Breakdown
Residential
7,308
Single Family
6,526
Multi-Family
782
Businesses
95
Nearby investment properties with comparable rents
Nearby investment properties with comparable prices
Listed by: N/A • Texas Signature Custom Homes
Mls Name: Texas Signature Custom Homes
Mls ID: #N/A