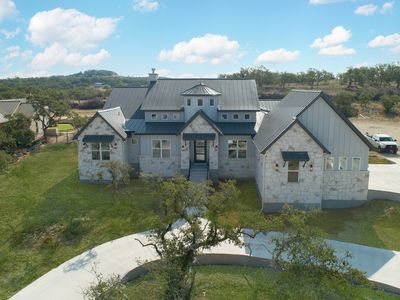
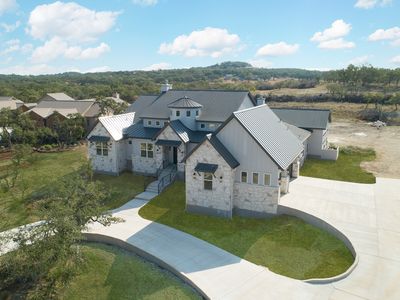
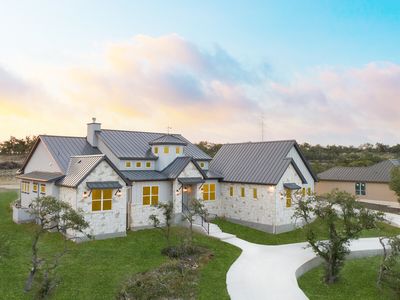
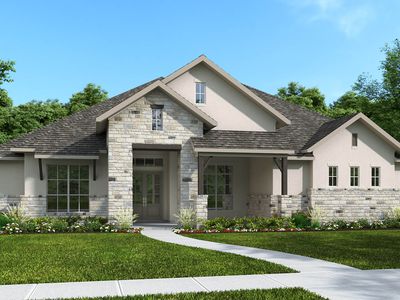
Belle Oaks Bulverde Plan, Canyons at Scenic LoopSan AntonioTX78255
INVESTMENT ANALYSIS
Investment Verdict
Appreciation PlayBelle Oaks Bulverde Plan, Canyons at Scenic Loop, San Antonio, TX, 78255 in San Antonio is priced for appreciation, not yield. Rental yield 0%. At $1,239,325 with a 0% gross yield, the monthly income is modest, but 5% annual price growth is projected to add $342,403 in value over five years, making equity the primary return driver. Ziffy Mortgage's DSCR mortgage (0.00) can still finance this property for non-U.S. residents; a 30–35% down payment typically produces the cleanest underwriting for appreciation-focused assets.
| This Property | City Avg | |
|---|---|---|
| Gross Rental Yield | 0% | 5.8% |
| Monthly Cash Flow | $0 | $450 |
City averages based on San Antonio market data in our database. Property projections are estimates.
Single Family
Built in N/A
N/A lot
$N/A/sqft
No HOA
Neighborhood Data
Neighborhood data shown for ZIP Code: 78255, San Antonio, TX area.
Housing Distribution
Housing Statistics
| Category | Value |
|---|---|
| Total HU (Housing Units) | 8,946 (100%) |
| Owner Occupied HU | 5,821 (65.1%) |
| Renter Occupied HU | 2,263 (25.3%) |
| Vacant Housing Units | 862 ( 9.6%) |
| Median Home Value | $490,774 |
| Average Home Value | $527,540 |
Housing Distribution
Address Breakdown
Residential
7,308
Single Family
6,526
Multi-Family
782
Businesses
95


Nearby investment properties with comparable rents
No similar rental properties found nearby.
Nearby investment properties with comparable prices
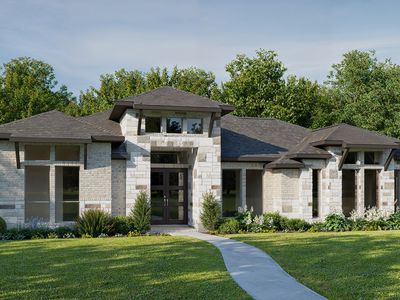
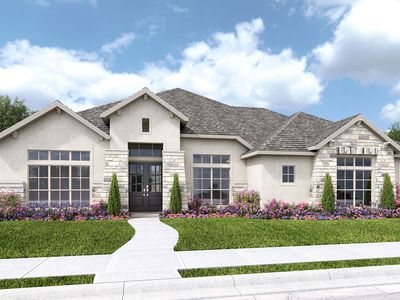

Ziffy AI Summary
A quick, investor-focused snapshot highlighting income strength, yield potential.
| Key metrics | Value |
|---|---|
| Price | $399,900 |
| Est. Rent | $3,200/mo |
| ROI | 18% |
- Attractive rent-to-price ratio for income stability
- Good fit for DSCR financing with healthy coverage
Single Family
Built in N/A
N/A lot
$N/A/sqft
No HOA
Neighborhood Data
Neighborhood data shown for ZIP Code: 78255, San Antonio, TX area.
Housing Distribution
Housing Statistics
| Category | Value |
|---|---|
| Total HU (Housing Units) | 8,946 (100%) |
| Owner Occupied HU | 5,821 (65.1%) |
| Renter Occupied HU | 2,263 (25.3%) |
| Vacant Housing Units | 862 ( 9.6%) |
| Median Home Value | $490,774 |
| Average Home Value | $527,540 |
Housing Distribution
Address Breakdown
Residential
7,308
Single Family
6,526
Multi-Family
782
Businesses
95
Nearby investment properties with comparable rents
No similar rental properties found nearby.
Nearby investment properties with comparable prices
Listed by: N/A • N/A
Mls Name: undefined
Mls ID: #N/A