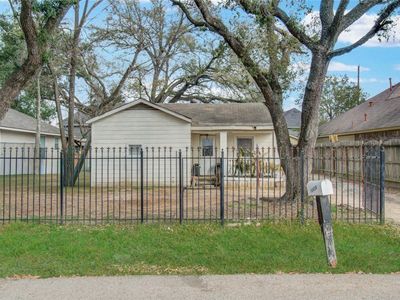
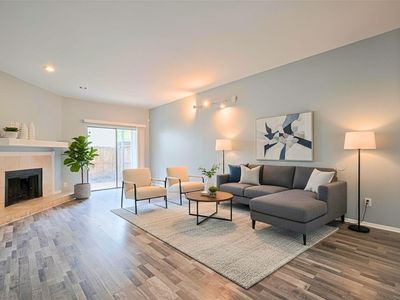
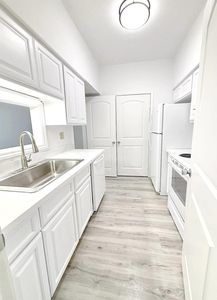
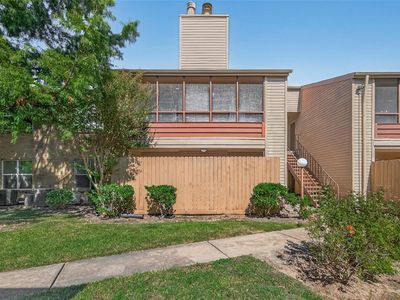
9423 Bollingbrook DrHoustonTX77083

INVESTMENT ANALYSIS
Investment Verdict
Strong Cash FlowInvestors targeting immediate dollar income will find 9423 Bollingbrook Dr, Houston, TX, 77083 in Houston hard to pass up. The 14.76% gross yield on a $166,700 purchase results in $2,051/mo in rent and $850/mo in net cash, well above the spread required for Ziffy Mortgage's DSCR qualification (2.73). Annual cash flow of $10,204, five-year appreciation of $46,056, and $1,535/yr in equity build-up combine for a projected total cumulative return of $118,688.
| This Property | City Avg | |
|---|---|---|
| Gross Rental Yield | 14.8% | 6.2% |
| Monthly Cash Flow | $850 | $450 |
City averages based on Houston market data in our database. Property projections are estimates.
DSCR Rental Loan Qualification
Qualifies using the property's rental income, not your personal income.
- ✓No W-2, pay stubs, or tax returns needed
- ✓Rental income qualifies you
- ✓Built for real estate investors
| Monthly Rental Income | $2,051 |
| Total Monthly Debt Service | $1,134 |
| DSCR Ratio | 1.81x |
Ziffy Mortgage: Your DSCR most likely meets our 1.0+ requirement, so you'll most probably qualify for our standard DSCR investment loan program. To pre-qualify, book time with your loan officer →
Estimates assume 6.0% rate / 30-yr fixed, 30% down, 1% tax, 0.5% insurance. Not a commitment to lend.
Multi Family
Built in 1981
5,183 sqft lot
$N/A/sqft
$15 monthly HOA
Neighborhood Data
Neighborhood data shown for ZIP Code: 77083, Houston, TX area.
Housing Distribution
Housing Statistics
| Category | Value |
|---|---|
| Total HU (Housing Units) | 22,942 (100%) |
| Owner Occupied HU | 14,881 (64.9%) |
| Renter Occupied HU | 7,425 (32.4%) |
| Vacant Housing Units | 636 ( 2.8%) |
| Median Home Value | $257,596 |
| Average Home Value | $292,331 |
Housing Distribution
Address Breakdown
Residential
22,671
Single Family
18,760
Multi-Family
3,911
Businesses
1,018


Nearby investment properties with comparable rents
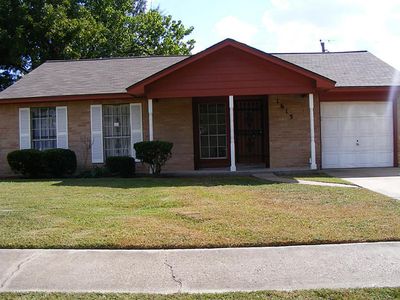
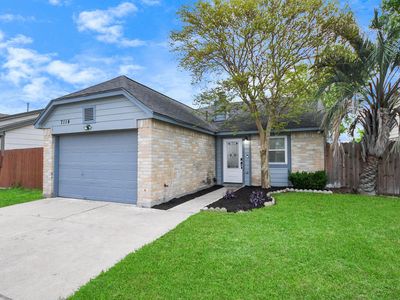
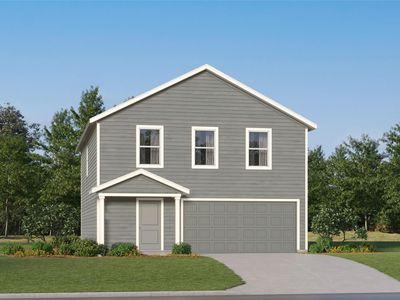
Nearby investment properties with comparable prices


Ziffy AI Summary
A quick, investor-focused snapshot highlighting income strength, yield potential.
| Key metrics | Value |
|---|---|
| Price | $399,900 |
| Est. Rent | $3,200/mo |
| ROI | 18% |
- Attractive rent-to-price ratio for income stability
- Good fit for DSCR financing with healthy coverage
Multi Family
Built in 1981
5,183 sqft lot
$N/A/sqft
$15 monthly HOA
Neighborhood Data
Neighborhood data shown for ZIP Code: 77083, Houston, TX area.
Housing Distribution
Housing Statistics
| Category | Value |
|---|---|
| Total HU (Housing Units) | 22,942 (100%) |
| Owner Occupied HU | 14,881 (64.9%) |
| Renter Occupied HU | 7,425 (32.4%) |
| Vacant Housing Units | 636 ( 2.8%) |
| Median Home Value | $257,596 |
| Average Home Value | $292,331 |
Housing Distribution
Address Breakdown
Residential
22,671
Single Family
18,760
Multi-Family
3,911
Businesses
1,018
Nearby investment properties with comparable rents
Nearby investment properties with comparable prices