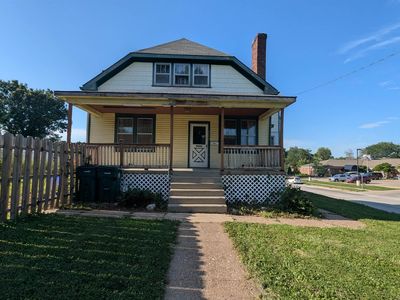
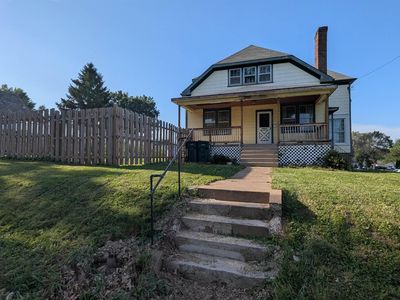
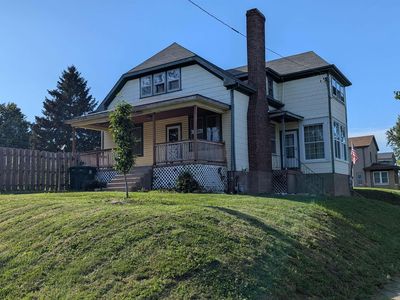
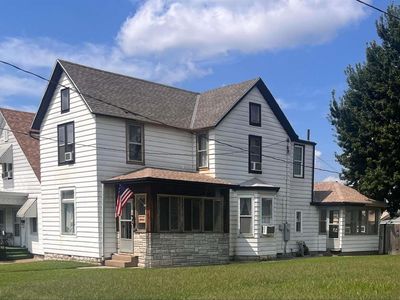
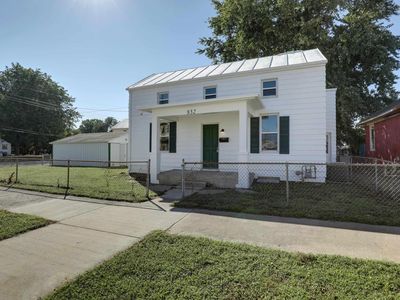
927 Sycamore StQuincyIL62301
INVESTMENT ANALYSIS
Investment Verdict
Solid Income927 Sycamore St, Quincy, IL, 62301 in Quincy earns a respectable 9.54% gross yield at $119,000, but after the $535/mo mortgage the net cash flow is $121/mo, a tight but positive spread. Expense discipline (vacancy, management, maintenance) will determine whether the margin widens. Ziffy Mortgage's DSCR mortgage (1.77) still qualifies on property income; a larger down payment can improve the cash-flow buffer. Long-term, 5% appreciation projects $32,878 over five years, making equity the dominant return driver. Total projected return: $53,333.
| This Property | City Avg | |
|---|---|---|
| Gross Rental Yield | 9.5% | 6.5% |
| Monthly Cash Flow | $121 | $300 |
City averages based on Quincy market data in our database. Property projections are estimates.
DSCR Rental Loan Qualification
Qualifies using the property's rental income, not your personal income.
- ✓No W-2, pay stubs, or tax returns needed
- ✓Rental income qualifies you
- ✓Built for real estate investors
| Monthly Rental Income | $946 |
| Total Monthly Debt Service | $778 |
| DSCR Ratio | 1.22x |
Ziffy Mortgage: Your DSCR most likely meets our 1.0+ requirement, so you'll most probably qualify for our standard DSCR investment loan program. To pre-qualify, book time with your loan officer →
Estimates assume 6.0% rate / 30-yr fixed, 30% down, 1% tax, 0.5% insurance. Not a commitment to lend.
Single Family
Built in 1923
8,276 sqft lot
$N/A/sqft
No HOA
Neighborhood Data
Neighborhood data shown for ZIP Code: 62301, Quincy, IL area.
Housing Distribution
Housing Statistics
| Category | Value |
|---|---|
| Total HU (Housing Units) | 15,397 (100%) |
| Owner Occupied HU | 8,347 (54.2%) |
| Renter Occupied HU | 5,101 (33.1%) |
| Vacant Housing Units | 1,949 (12.7%) |
| Median Home Value | $140,293 |
| Average Home Value | $168,944 |
Housing Distribution
Address Breakdown
Residential
14,221
Single Family
13,255
Multi-Family
966
Businesses
1,299


Nearby investment properties with comparable rents
Nearby investment properties with comparable prices

Ziffy AI Summary
A quick, investor-focused snapshot highlighting income strength, yield potential.
| Key metrics | Value |
|---|---|
| Price | $399,900 |
| Est. Rent | $3,200/mo |
| ROI | 18% |
- Attractive rent-to-price ratio for income stability
- Good fit for DSCR financing with healthy coverage
Single Family
Built in 1923
8,276 sqft lot
$N/A/sqft
No HOA
Neighborhood Data
Neighborhood data shown for ZIP Code: 62301, Quincy, IL area.
Housing Distribution
Housing Statistics
| Category | Value |
|---|---|
| Total HU (Housing Units) | 15,397 (100%) |
| Owner Occupied HU | 8,347 (54.2%) |
| Renter Occupied HU | 5,101 (33.1%) |
| Vacant Housing Units | 1,949 (12.7%) |
| Median Home Value | $140,293 |
| Average Home Value | $168,944 |
Housing Distribution
Address Breakdown
Residential
14,221
Single Family
13,255
Multi-Family
966
Businesses
1,299
Nearby investment properties with comparable rents
Nearby investment properties with comparable prices
Listed by: Dustin Vance • Davis & Associates, REALTORS
Mls Name: RMLS Alliance
Mls Provider:
Mls ID: #CA1037781
Disclaimer: IDX information is provided exclusively for personal, non-commercial use, and may not be used for any purpose other than to identify prospective properties consumers may be interested in purchasing. Information is deemed reliable but not guaranteed.