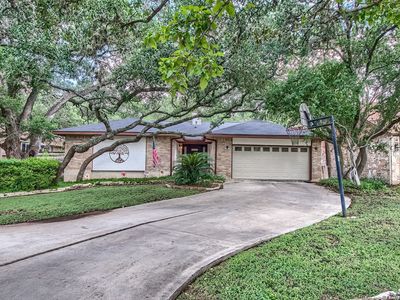
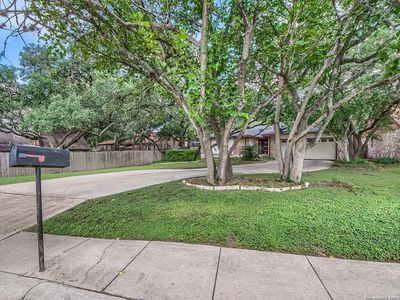
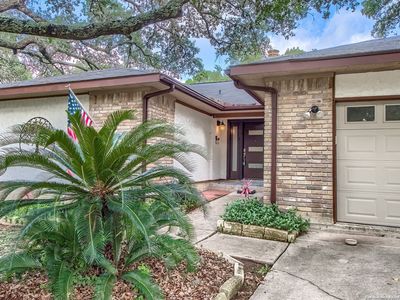
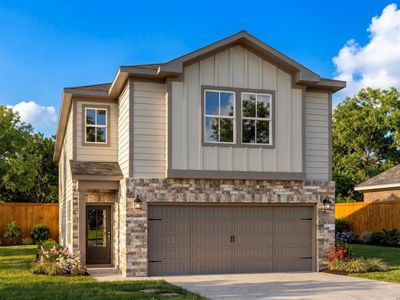
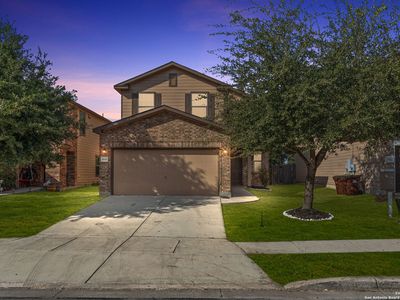
9215 ThornburySan AntonioTX78250
INVESTMENT ANALYSIS
Investment Verdict
Strong Cash FlowDay-one income is the story at 9215 Thornbury, San Antonio, TX, 78250 in San Antonio. Priced at $305,000, it generates $2,753/mo in gross rent and $563/mo in net monthly cash flow, a 10.83% yield that comfortably supports the 2.01 DSCR needed for Ziffy Mortgage's no-W2 DSCR mortgage. Projected annual cash flow: $6,757. Five-year appreciation: $84,266. Equity from principal paydown: $2,809/yr. Total projected cumulative return: $153,278.
| This Property | City Avg | |
|---|---|---|
| Gross Rental Yield | 10.8% | 5.8% |
| Monthly Cash Flow | $563 | $450 |
City averages based on San Antonio market data in our database. Property projections are estimates.
DSCR Rental Loan Qualification
Qualifies using the property's rental income, not your personal income.
- ✓No W-2, pay stubs, or tax returns needed
- ✓Rental income qualifies you
- ✓Built for real estate investors
| Monthly Rental Income | $2,753 |
| Total Monthly Debt Service | $2,068 |
| DSCR Ratio | 1.33x |
Ziffy Mortgage: Your DSCR most likely meets our 1.0+ requirement, so you'll most probably qualify for our standard DSCR investment loan program. To pre-qualify, book time with your loan officer →
Estimates assume 6.0% rate / 30-yr fixed, 30% down, 1% tax, 0.5% insurance. Not a commitment to lend.
Single Family
Built in 1982
0.29 Acres lot
$N/A/sqft
$250 annually HOA
Neighborhood Data
Neighborhood data shown for ZIP Code: 78250, San Antonio, TX area.
Housing Distribution
Housing Statistics
| Category | Value |
|---|---|
| Total HU (Housing Units) | 19,819 (100%) |
| Owner Occupied HU | 14,411 (72.7%) |
| Renter Occupied HU | 4,612 (23.3%) |
| Vacant Housing Units | 796 ( 4.0%) |
| Median Home Value | $257,293 |
| Average Home Value | $298,692 |
Housing Distribution
Address Breakdown
Residential
20,141
Single Family
18,477
Multi-Family
1,664
Businesses
625


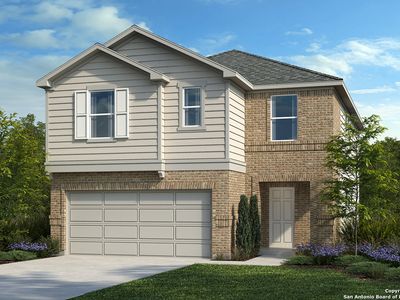
Nearby investment properties with comparable rents
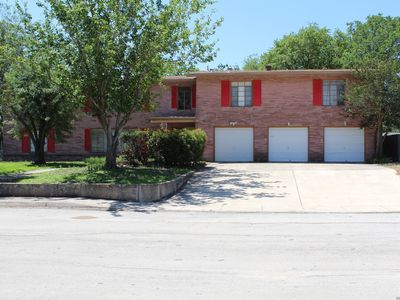
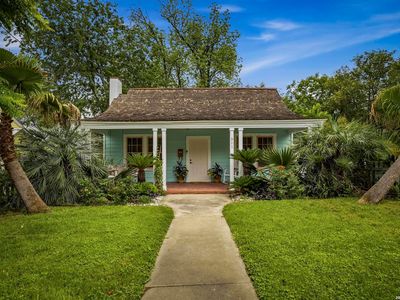
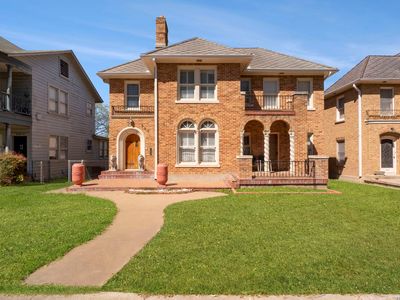
Nearby investment properties with comparable prices
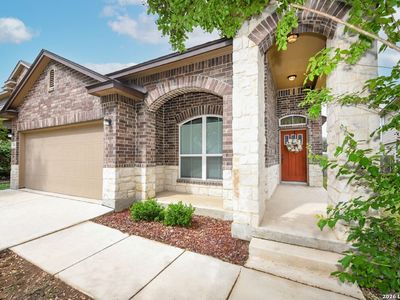

Ziffy AI Summary
A quick, investor-focused snapshot highlighting income strength, yield potential.
| Key metrics | Value |
|---|---|
| Price | $399,900 |
| Est. Rent | $3,200/mo |
| ROI | 18% |
- Attractive rent-to-price ratio for income stability
- Good fit for DSCR financing with healthy coverage
Single Family
Built in 1982
0.29 Acres lot
$N/A/sqft
$250 annually HOA
Neighborhood Data
Neighborhood data shown for ZIP Code: 78250, San Antonio, TX area.
Housing Distribution
Housing Statistics
| Category | Value |
|---|---|
| Total HU (Housing Units) | 19,819 (100%) |
| Owner Occupied HU | 14,411 (72.7%) |
| Renter Occupied HU | 4,612 (23.3%) |
| Vacant Housing Units | 796 ( 4.0%) |
| Median Home Value | $257,293 |
| Average Home Value | $298,692 |
Housing Distribution
Address Breakdown
Residential
20,141
Single Family
18,477
Multi-Family
1,664
Businesses
625
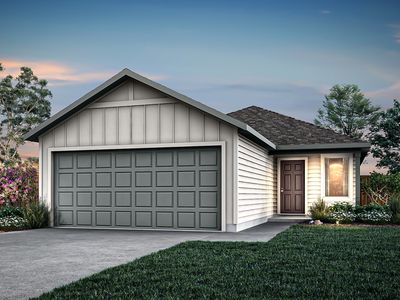
Nearby investment properties with comparable rents
Nearby investment properties with comparable prices
Listed by: Jewel McCullough • JewelProperties, LLC
Mls Name: SABOR
Mls Provider:
Mls ID: #1885453
Disclaimer: IDX information is provided exclusively for personal, non-commercial use, and may not be used for any purpose other than to identify prospective properties consumers may be interested in purchasing. Information is deemed reliable but not guaranteed.