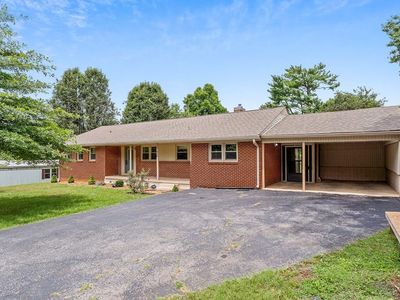
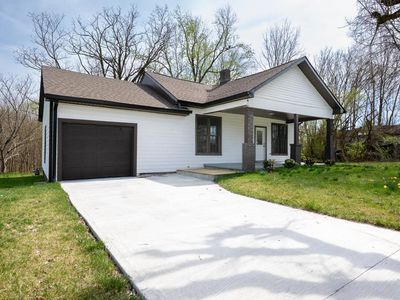
908 Chestnut StLivingstonTN38570
INVESTMENT ANALYSIS
Investment Verdict
Strong Cash FlowIf cash-on-cash performance is your primary filter, 908 Chestnut St, Livingston, TN, 38570 in Livingston deserves attention. This $222,500 property earns $2,002/mo in rent, a 10.8% gross yield, and nets $670/mo after the $1,001/mo payment. DSCR 2.00 makes it one of the cleaner DSCR underwriting candidates Ziffy Mortgage sees in this market. Five-year appreciation of $61,473 compounds alongside $2,049/yr in yearly equity build, for a total cumulative return of $127,375.
| This Property | National Avg | |
|---|---|---|
| Gross Rental Yield | 10.8% | 6.2% |
| Monthly Cash Flow | $670 | $180 |
National averages based on 2024–2025 U.S. residential rental market data. Content is user-generated and unverified.
DSCR Rental Loan Qualification
Qualifies using the property's rental income, not your personal income.
- ✓No W-2, pay stubs, or tax returns needed
- ✓Rental income qualifies you
- ✓Built for real estate investors
| Monthly Rental Income | $2,002 |
| Total Monthly Debt Service | $1,243 |
| DSCR Ratio | 1.61x |
Ziffy Mortgage: Your DSCR most likely meets our 1.0+ requirement, so you'll most probably qualify for our standard DSCR investment loan program. To pre-qualify, book time with your loan officer →
Estimates assume 6.0% rate / 30-yr fixed, 30% down, 1% tax, 0.5% insurance. Not a commitment to lend.
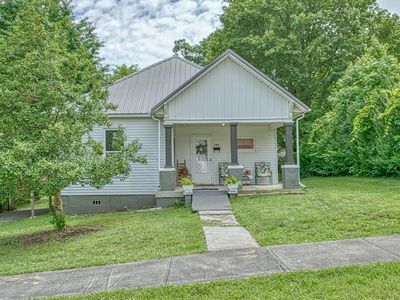
Single Family
Built in 1944
N/A lot
$N/A/sqft
No HOA
Neighborhood Data
Neighborhood data shown for ZIP Code: 38570, Livingston, TN area.
Housing Distribution
Housing Statistics
| Category | Value |
|---|---|
| Total HU (Housing Units) | 4,552 (100%) |
| Owner Occupied HU | 2,980 (65.5%) |
| Renter Occupied HU | 1,075 (23.6%) |
| Vacant Housing Units | 497 (10.9%) |
| Median Home Value | $243,421 |
| Average Home Value | $294,714 |
Housing Distribution
Address Breakdown
Residential
4,334
Single Family
4,293
Multi-Family
41
Businesses
539


Nearby investment properties with comparable rents
Nearby investment properties with comparable prices


Ziffy AI Summary
A quick, investor-focused snapshot highlighting income strength, yield potential.
| Key metrics | Value |
|---|---|
| Price | $399,900 |
| Est. Rent | $3,200/mo |
| ROI | 18% |
- Attractive rent-to-price ratio for income stability
- Good fit for DSCR financing with healthy coverage
Single Family
Built in 1944
N/A lot
$N/A/sqft
No HOA
Neighborhood Data
Neighborhood data shown for ZIP Code: 38570, Livingston, TN area.
Housing Distribution
Housing Statistics
| Category | Value |
|---|---|
| Total HU (Housing Units) | 4,552 (100%) |
| Owner Occupied HU | 2,980 (65.5%) |
| Renter Occupied HU | 1,075 (23.6%) |
| Vacant Housing Units | 497 (10.9%) |
| Median Home Value | $243,421 |
| Average Home Value | $294,714 |
Housing Distribution
Address Breakdown
Residential
4,334
Single Family
4,293
Multi-Family
41
Businesses
539
Nearby investment properties with comparable rents
Nearby investment properties with comparable prices
Listed by: Bridget Salazar • The Realty Firm
Mls Name: UCMLS
Mls Provider:
Mls ID: #236544
Disclaimer: Copyright 2025 Upper Cumberland Board of Realtors. All rights reserved. Information deemed to be reliable but not guaranteed. The data relating to real estate for sale on this website comes from Upper Cumberland Board of Realtors. Some or all of the listings displayed may not belong to the firm whose website is being visited.