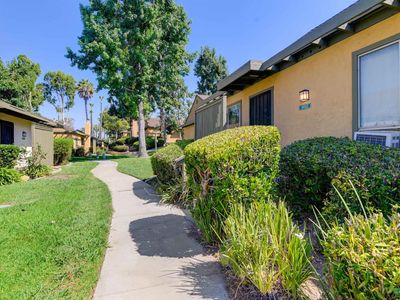
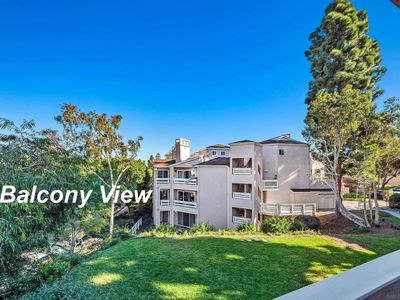
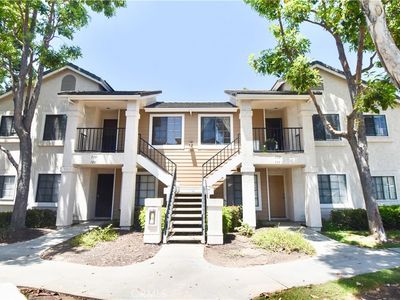
8922 Flanders DrSan DiegoCA92126
INVESTMENT ANALYSIS
Investment Verdict
Strong Cash FlowIf cash-on-cash performance is your primary filter, 8922 Flanders Dr, San Diego, CA, 92126 in San Diego deserves attention. This $739,000 property earns $7,465/mo in rent, a 12.12% gross yield, and nets $2,551/mo after the $3,323/mo payment. DSCR 2.25 makes it one of the cleaner DSCR underwriting candidates Ziffy Mortgage sees in this market. Five-year appreciation of $204,172 compounds alongside $6,806/yr in yearly equity build, for a total cumulative return of $445,840.
| This Property | City Avg | |
|---|---|---|
| Gross Rental Yield | 12.1% | 4.8% |
| Monthly Cash Flow | $2,551 | $1,850 |
City averages based on San Diego market data in our database. Property projections are estimates.
DSCR Rental Loan Qualification
Qualifies using the property's rental income, not your personal income.
- ✓No W-2, pay stubs, or tax returns needed
- ✓Rental income qualifies you
- ✓Built for real estate investors
| Monthly Rental Income | $7,465 |
| Total Monthly Debt Service | $4,621 |
| DSCR Ratio | 1.62x |
Ziffy Mortgage: Your DSCR most likely meets our 1.0+ requirement, so you'll most probably qualify for our standard DSCR investment loan program. To pre-qualify, book time with your loan officer →
Estimates assume 6.0% rate / 30-yr fixed, 30% down, 1% tax, 0.5% insurance. Not a commitment to lend.
Townhouse
Built in 1973
6.94 Acres lot
$N/A/sqft
$343 monthly HOA
Neighborhood Data
Neighborhood data shown for ZIP Code: 92126, San Diego, CA area.
Housing Distribution
Housing Statistics
| Category | Value |
|---|---|
| Total HU (Housing Units) | 27,181 (100%) |
| Owner Occupied HU | 14,103 (51.9%) |
| Renter Occupied HU | 12,174 (44.8%) |
| Vacant Housing Units | 904 ( 3.3%) |
| Median Home Value | $865,575 |
| Average Home Value | $948,704 |
Housing Distribution
Address Breakdown
Residential
26,625
Single Family
20,637
Multi-Family
5,988
Businesses
1,972


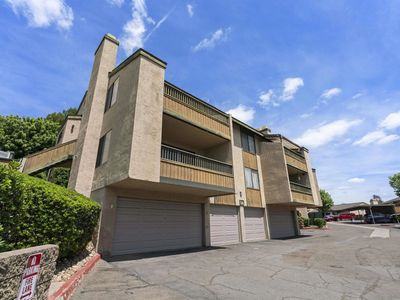
Nearby investment properties with comparable rents
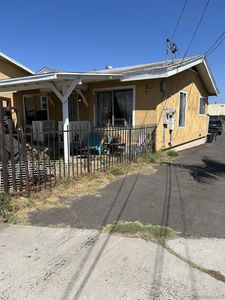
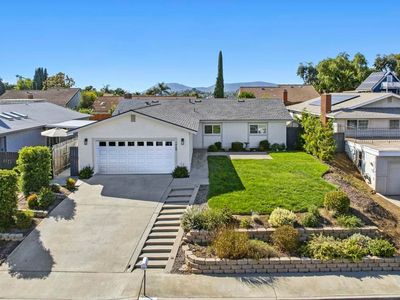
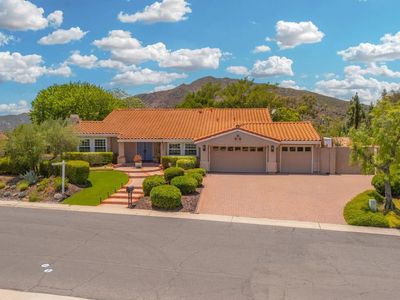
Nearby investment properties with comparable prices

Ziffy AI Summary
A quick, investor-focused snapshot highlighting income strength, yield potential.
| Key metrics | Value |
|---|---|
| Price | $399,900 |
| Est. Rent | $3,200/mo |
| ROI | 18% |
- Attractive rent-to-price ratio for income stability
- Good fit for DSCR financing with healthy coverage
Townhouse
Built in 1973
6.94 Acres lot
$N/A/sqft
$343 monthly HOA
Neighborhood Data
Neighborhood data shown for ZIP Code: 92126, San Diego, CA area.
Housing Distribution
Housing Statistics
| Category | Value |
|---|---|
| Total HU (Housing Units) | 27,181 (100%) |
| Owner Occupied HU | 14,103 (51.9%) |
| Renter Occupied HU | 12,174 (44.8%) |
| Vacant Housing Units | 904 ( 3.3%) |
| Median Home Value | $865,575 |
| Average Home Value | $948,704 |
Housing Distribution
Address Breakdown
Residential
26,625
Single Family
20,637
Multi-Family
5,988
Businesses
1,972
Nearby investment properties with comparable rents
Nearby investment properties with comparable prices