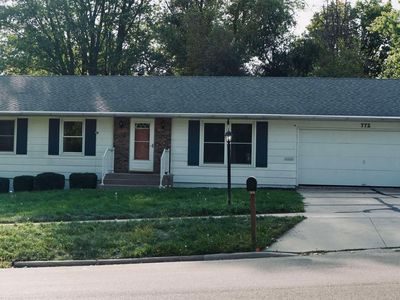
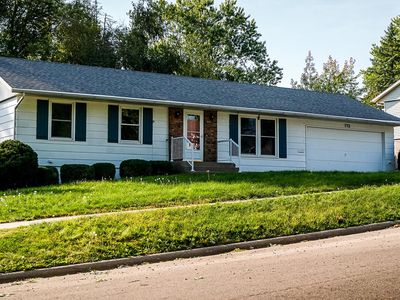
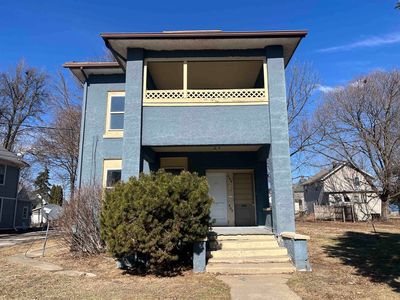
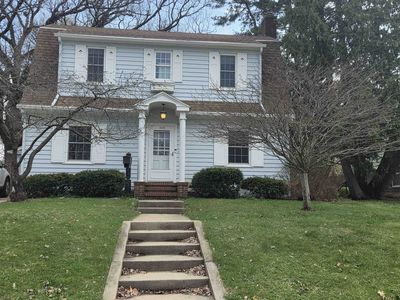
772 S Carthage DrFreeportIL61032
INVESTMENT ANALYSIS
Investment Verdict
Solid IncomeTight but positive: 772 S Carthage Dr, Freeport, IL, 61032 in Freeport at $158,500 earns $1,248/mo in rent and nets $149/mo after the $713/mo payment, a 9.45% yield with limited short-term income headroom. The equity story offsets the thin monthly spread: 5% annual appreciation adds $43,791 over five years. Ziffy Mortgage underwrites this on a 1.75 DSCR without U.S. credit history. With $1,460/yr in principal paydown, total projected return reaches $70,203.
| This Property | City Avg | |
|---|---|---|
| Gross Rental Yield | 9.5% | 8.0% |
| Monthly Cash Flow | $149 | $800 |
City averages based on Freeport market data in our database. Property projections are estimates.
DSCR Rental Loan Qualification
Qualifies using the property's rental income, not your personal income.
- ✓No W-2, pay stubs, or tax returns needed
- ✓Rental income qualifies you
- ✓Built for real estate investors
| Monthly Rental Income | $1,248 |
| Total Monthly Debt Service | $1,036 |
| DSCR Ratio | 1.20x |
Ziffy Mortgage: Your DSCR most likely meets our 1.0+ requirement, so you'll most probably qualify for our standard DSCR investment loan program. To pre-qualify, book time with your loan officer →
Estimates assume 6.0% rate / 30-yr fixed, 30% down, 1% tax, 0.5% insurance. Not a commitment to lend.
Single Family
Built in 1968
9,583 sqft lot
$N/A/sqft
No HOA
Neighborhood Data
Neighborhood data shown for ZIP Code: 61032, Freeport, IL area.
Housing Distribution
Housing Statistics
| Category | Value |
|---|---|
| Total HU (Housing Units) | 14,514 (100%) |
| Owner Occupied HU | 8,485 (58.5%) |
| Renter Occupied HU | 4,354 (30.0%) |
| Vacant Housing Units | 1,675 (11.5%) |
| Median Home Value | $117,056 |
| Average Home Value | $149,942 |
Housing Distribution
Address Breakdown
Residential
13,208
Single Family
12,024
Multi-Family
1,184
Businesses
1,072


Nearby investment properties with comparable rents

Nearby investment properties with comparable prices

Ziffy AI Summary
A quick, investor-focused snapshot highlighting income strength, yield potential.
| Key metrics | Value |
|---|---|
| Price | $399,900 |
| Est. Rent | $3,200/mo |
| ROI | 18% |
- Attractive rent-to-price ratio for income stability
- Good fit for DSCR financing with healthy coverage
Single Family
Built in 1968
9,583 sqft lot
$N/A/sqft
No HOA
Neighborhood Data
Neighborhood data shown for ZIP Code: 61032, Freeport, IL area.
Housing Distribution
Housing Statistics
| Category | Value |
|---|---|
| Total HU (Housing Units) | 14,514 (100%) |
| Owner Occupied HU | 8,485 (58.5%) |
| Renter Occupied HU | 4,354 (30.0%) |
| Vacant Housing Units | 1,675 (11.5%) |
| Median Home Value | $117,056 |
| Average Home Value | $149,942 |
Housing Distribution
Address Breakdown
Residential
13,208
Single Family
12,024
Multi-Family
1,184
Businesses
1,072
Nearby investment properties with comparable rents
Nearby investment properties with comparable prices