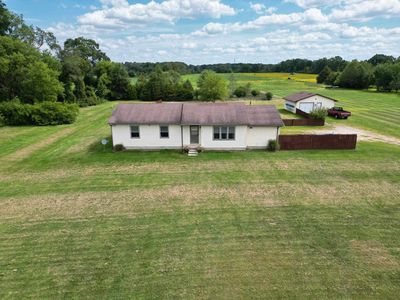
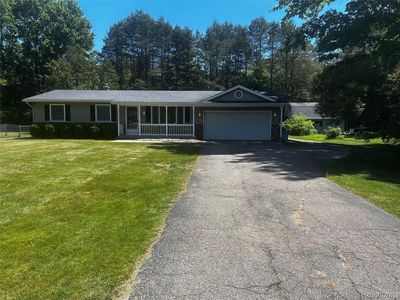
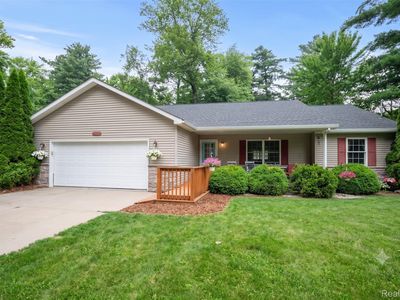
7316 N Webster RdMount MorrisMI48458
INVESTMENT ANALYSIS
Investment Verdict
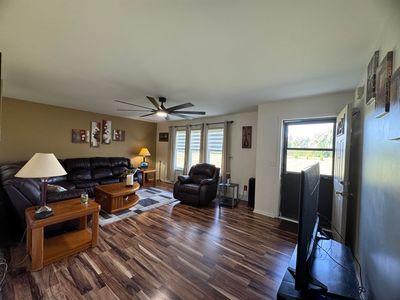
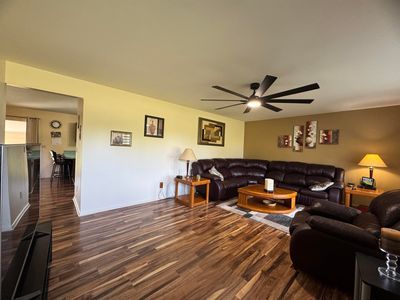
Solid IncomeInvestors who treat current yield as secondary to long-run equity growth will find 7316 N Webster Rd, Mount Morris, MI, 48458 in Mount Morris worth modelling. At $299,900 with a 8.13% gross yield, the $2,032/mo rent leaves $54/mo after the $1,349/mo payment, sufficient to cover costs, modest in distribution. Ziffy Mortgage's 1.51 DSCR loan can finance the acquisition without personal income documentation. Appreciation of 5%/yr is projected to add $82,857 by year five; $2,762/yr in principal reduction adds further equity. Total projected return: $117,763.
| This Property | City Avg | |
|---|---|---|
| Gross Rental Yield | 8.1% | 8.2% |
| Monthly Cash Flow | $54 | $450 |
City averages based on Mount Morris market data in our database. Property projections are estimates.
DSCR Rental Loan Qualification
Qualifies using the property's rental income, not your personal income.
- ✓No W-2, pay stubs, or tax returns needed
- ✓Rental income qualifies you
- ✓Built for real estate investors
| Monthly Rental Income | $2,032 |
| Total Monthly Debt Service | $1,858 |
| DSCR Ratio | 1.09x |
Ziffy Mortgage: Your DSCR most likely meets our 1.0+ requirement, so you'll most probably qualify for our standard DSCR investment loan program. To pre-qualify, book time with your loan officer →
Estimates assume 6.0% rate / 30-yr fixed, 30% down, 1% tax, 0.5% insurance. Not a commitment to lend.
Single Family
Built in 1992
10.16 Acres lot
$N/A/sqft
No HOA
Neighborhood Data
Neighborhood data shown for ZIP Code: 48458, Mount Morris, MI area.
Housing Distribution
Housing Statistics
| Category | Value |
|---|---|
| Total HU (Housing Units) | 9,202 (100%) |
| Owner Occupied HU | 5,702 (62.0%) |
| Renter Occupied HU | 2,454 (26.7%) |
| Vacant Housing Units | 1,046 (11.4%) |
| Median Home Value | $111,359 |
| Average Home Value | $156,507 |
Housing Distribution
Address Breakdown
Residential
8,037
Single Family
6,871
Multi-Family
1,166
Businesses
312


Nearby investment properties with comparable rents
Nearby investment properties with comparable prices

Ziffy AI Summary
A quick, investor-focused snapshot highlighting income strength, yield potential.
| Key metrics | Value |
|---|---|
| Price | $399,900 |
| Est. Rent | $3,200/mo |
| ROI | 18% |
- Attractive rent-to-price ratio for income stability
- Good fit for DSCR financing with healthy coverage
Single Family
Built in 1992
10.16 Acres lot
$N/A/sqft
No HOA
Neighborhood Data
Neighborhood data shown for ZIP Code: 48458, Mount Morris, MI area.
Housing Distribution
Housing Statistics
| Category | Value |
|---|---|
| Total HU (Housing Units) | 9,202 (100%) |
| Owner Occupied HU | 5,702 (62.0%) |
| Renter Occupied HU | 2,454 (26.7%) |
| Vacant Housing Units | 1,046 (11.4%) |
| Median Home Value | $111,359 |
| Average Home Value | $156,507 |
Housing Distribution
Address Breakdown
Residential
8,037
Single Family
6,871
Multi-Family
1,166
Businesses
312
Nearby investment properties with comparable rents
Nearby investment properties with comparable prices
Listed by: Lucinda M Dewar • REMAX Right Choice
Mls Name: MiRealSource
Mls ID: #50187215