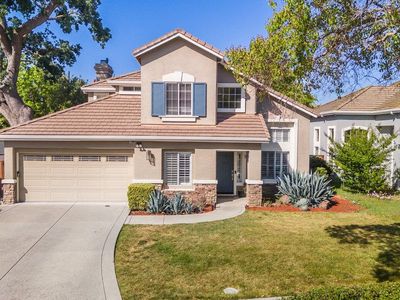
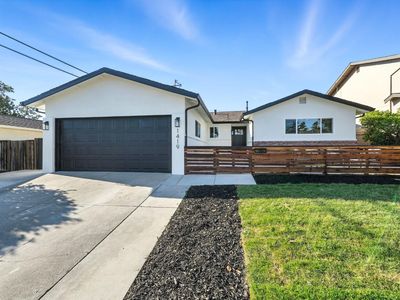
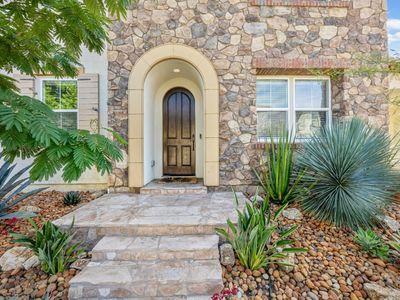
7290 Downs DrSan JoseCA95139
INVESTMENT ANALYSIS
Investment Verdict
Appreciation PlayGlobal investors willing to prioritise equity over near-term yield will find 7290 Downs Dr, San Jose, CA, 95139 in San Jose worth study. Rental yield 3.83%. The 3.83% gross yield is below cash-flow benchmarks at $1,780,000, but 5% annual appreciation, adding $491,781 over five years, frames this as a capital growth position. Rent of $5,100/mo partially offsets the $8,004/mo payment. Ziffy Mortgage finances appreciation-play properties (0.64 DSCR) for non-U.S. residents without domestic income documentation; a 30–35% down payment maximises coverage. Total projected return: $276,802.
| This Property | City Avg | |
|---|---|---|
| Gross Rental Yield | 3.8% | 6.0% |
| Monthly Cash Flow | $(5,196) | $500 |
City averages based on San Jose market data in our database. Property projections are estimates.
DSCR Rental Loan Qualification
Qualifies using the property's rental income, not your personal income.
- ✓No W-2, pay stubs, or tax returns needed
- ✓Rental income qualifies you
- ✓Built for real estate investors
| Monthly Rental Income | $5,100 |
| Total Monthly Debt Service | $10,598 |
| DSCR Ratio | 0.48x |
Ziffy Mortgage typically prefers a DSCR of 1.0+, but in some cases you may qualify with a DSCR below 1. To explore if this deal qualifies for an investment mortgage, book time with your loan officer →
Estimates assume 6.0% rate / 30-yr fixed, 30% down, 1% tax, 0.5% insurance. Not a commitment to lend.
Single Family
Built in 1996
6,000 sqft lot
$N/A/sqft
No HOA
Neighborhood Data
Neighborhood data shown for ZIP Code: 95139, San Jose, CA area.
Housing Distribution
Housing Statistics
| Category | Value |
|---|---|
| Total HU (Housing Units) | 2,283 (100%) |
| Owner Occupied HU | 1,762 (77.2%) |
| Renter Occupied HU | 484 (21.2%) |
| Vacant Housing Units | 37 ( 1.6%) |
| Median Home Value | $1,192,475 |
| Average Home Value | $1,290,261 |
Housing Distribution
Address Breakdown
Residential
2,220
Single Family
2,136
Multi-Family
84
Businesses
57


Nearby investment properties with comparable rents
Nearby investment properties with comparable prices
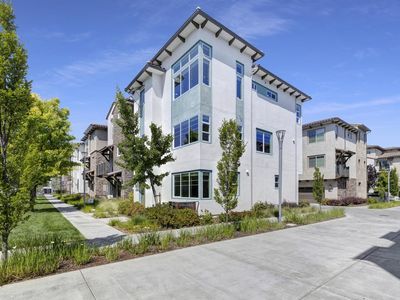

Ziffy AI Summary
A quick, investor-focused snapshot highlighting income strength, yield potential.
| Key metrics | Value |
|---|---|
| Price | $399,900 |
| Est. Rent | $3,200/mo |
| ROI | 18% |
- Attractive rent-to-price ratio for income stability
- Good fit for DSCR financing with healthy coverage
Single Family
Built in 1996
6,000 sqft lot
$N/A/sqft
No HOA
Neighborhood Data
Neighborhood data shown for ZIP Code: 95139, San Jose, CA area.
Housing Distribution
Housing Statistics
| Category | Value |
|---|---|
| Total HU (Housing Units) | 2,283 (100%) |
| Owner Occupied HU | 1,762 (77.2%) |
| Renter Occupied HU | 484 (21.2%) |
| Vacant Housing Units | 37 ( 1.6%) |
| Median Home Value | $1,192,475 |
| Average Home Value | $1,290,261 |
Housing Distribution
Address Breakdown
Residential
2,220
Single Family
2,136
Multi-Family
84
Businesses
57
Nearby investment properties with comparable rents
Nearby investment properties with comparable prices
Listed by: Joe Ventura • Corcoran Icon Properties
Mls Name: MLSListings Inc
Mls Provider:
Mls ID: #ML82006186
Disclaimer: Based on information from the MLSListings MLS as of 2025-10-23 01:09:31 PDT. All data, including all measurements and calculations of area, is obtained from various sources and has not been, and will not be, verified by broker or MLS. All information should be independently reviewed and verified for accuracy. Properties may or may not be listed by the office/agent presenting the information.