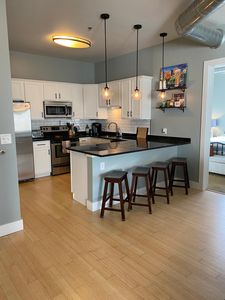
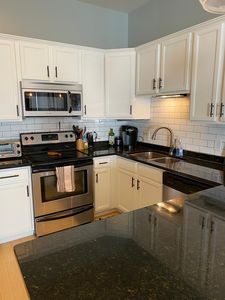
721 E North St APT 2CIndianapolisIN46202

INVESTMENT ANALYSIS
Investment Verdict
Strong Cash FlowInvestors targeting immediate dollar income will find 721 E North St APT 2C, Indianapolis, IN, 46202 in Indianapolis hard to pass up. The 10.24% gross yield on a $305,400 purchase results in $2,605/mo in rent and $758/mo in net cash, well above the spread required for Ziffy Mortgage's DSCR qualification (1.90). Annual cash flow of $9,101, five-year appreciation of $84,376, and $2,813/yr in equity build-up combine for a projected total cumulative return of $164,473.
| This Property | City Avg | |
|---|---|---|
| Gross Rental Yield | 10.2% | 6.8% |
| Monthly Cash Flow | $758 | $450 |
City averages based on Indianapolis market data in our database. Property projections are estimates.
DSCR Rental Loan Qualification
Qualifies using the property's rental income, not your personal income.
- ✓No W-2, pay stubs, or tax returns needed
- ✓Rental income qualifies you
- ✓Built for real estate investors
| Monthly Rental Income | $2,605 |
| Total Monthly Debt Service | $1,725 |
| DSCR Ratio | 1.51x |
Ziffy Mortgage: Your DSCR most likely meets our 1.0+ requirement, so you'll most probably qualify for our standard DSCR investment loan program. To pre-qualify, book time with your loan officer →
Estimates assume 6.0% rate / 30-yr fixed, 30% down, 1% tax, 0.5% insurance. Not a commitment to lend.
Apartment
Built in N/A
N/A lot
$N/A/sqft
No HOA
Neighborhood Data
Neighborhood data shown for ZIP Code: 46202, Indianapolis, IN area.
Housing Distribution
Housing Statistics
| Category | Value |
|---|---|
| Total HU (Housing Units) | 13,972 (100%) |
| Owner Occupied HU | 3,194 (22.9%) |
| Renter Occupied HU | 8,977 (64.2%) |
| Vacant Housing Units | 1,801 (12.9%) |
| Median Home Value | $408,240 |
| Average Home Value | $460,200 |
Housing Distribution
Address Breakdown
Residential
12,576
Single Family
6,063
Multi-Family
6,513
Businesses
1,266


Nearby investment properties with comparable rents

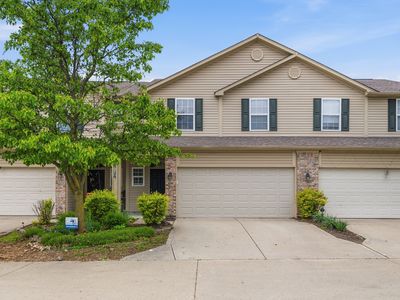


Nearby investment properties with comparable prices


Ziffy AI Summary
A quick, investor-focused snapshot highlighting income strength, yield potential.
| Key metrics | Value |
|---|---|
| Price | $399,900 |
| Est. Rent | $3,200/mo |
| ROI | 18% |
- Attractive rent-to-price ratio for income stability
- Good fit for DSCR financing with healthy coverage
Apartment
Built in N/A
N/A lot
$N/A/sqft
No HOA
Neighborhood Data
Neighborhood data shown for ZIP Code: 46202, Indianapolis, IN area.
Housing Distribution
Housing Statistics
| Category | Value |
|---|---|
| Total HU (Housing Units) | 13,972 (100%) |
| Owner Occupied HU | 3,194 (22.9%) |
| Renter Occupied HU | 8,977 (64.2%) |
| Vacant Housing Units | 1,801 (12.9%) |
| Median Home Value | $408,240 |
| Average Home Value | $460,200 |
Housing Distribution
Address Breakdown
Residential
12,576
Single Family
6,063
Multi-Family
6,513
Businesses
1,266
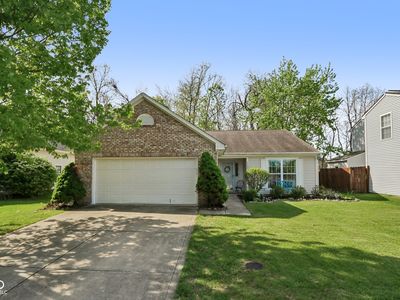
Nearby investment properties with comparable rents
Nearby investment properties with comparable prices
Listed by: N/A • N/A
Mls Name: Zillow Rentals
Mls ID: #N/A