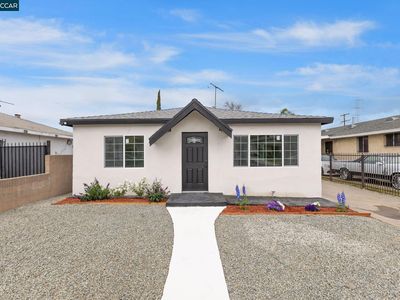
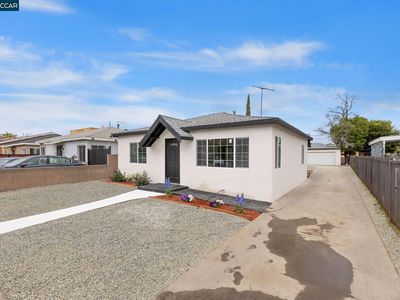
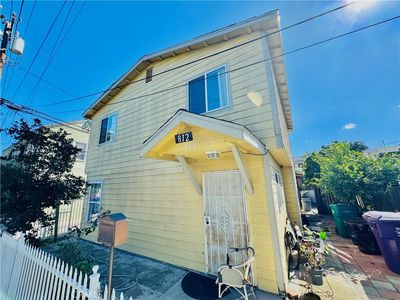
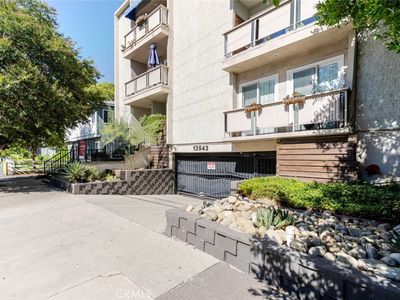
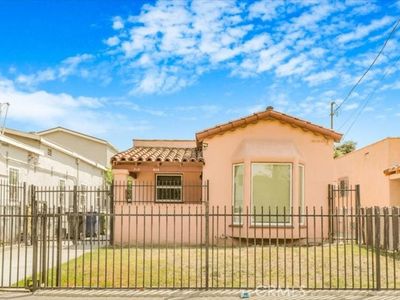
623 E 116th StLos AngelesCA90059
INVESTMENT ANALYSIS
Investment Verdict
Steady Equity Builder623 E 116th St, Los Angeles, CA, 90059 in Los Angeles earns a respectable 7.45% gross yield at $703,000, but after the $3,161/mo mortgage the net cash flow is $18/mo, a tight but positive spread. Expense discipline (vacancy, management, maintenance) will determine whether the margin widens. Ziffy Mortgage's DSCR mortgage (1.38) still qualifies on property income; a larger down payment can improve the cash-flow buffer. Long-term, 5% appreciation projects $194,226 over five years, making equity the dominant return driver. Total projected return: $267,723.
| This Property | City Avg | |
|---|---|---|
| Gross Rental Yield | 7.5% | 4.1% |
| Monthly Cash Flow | $18 | $1,850 |
City averages based on Los Angeles market data in our database. Property projections are estimates.
DSCR Rental Loan Qualification
Qualifies using the property's rental income, not your personal income.
- ✓No W-2, pay stubs, or tax returns needed
- ✓Rental income qualifies you
- ✓Built for real estate investors
| Monthly Rental Income | $4,367 |
| Total Monthly Debt Service | $4,069 |
| DSCR Ratio | 1.07x |
Ziffy Mortgage: Your DSCR most likely meets our 1.0+ requirement, so you'll most probably qualify for our standard DSCR investment loan program. To pre-qualify, book time with your loan officer →
Estimates assume 6.0% rate / 30-yr fixed, 30% down, 1% tax, 0.5% insurance. Not a commitment to lend.
Single Family
Built in 1946
5,680 sqft lot
$N/A/sqft
No HOA
Neighborhood Data
Neighborhood data shown for ZIP Code: 90059, Los Angeles, CA area.
Housing Distribution
Housing Statistics
| Category | Value |
|---|---|
| Total HU (Housing Units) | 11,293 (100%) |
| Owner Occupied HU | 4,787 (42.4%) |
| Renter Occupied HU | 6,165 (54.6%) |
| Vacant Housing Units | 341 ( 3.0%) |
| Median Home Value | $606,528 |
| Average Home Value | $681,341 |
Housing Distribution
Address Breakdown
Residential
10,288
Single Family
9,532
Multi-Family
756
Businesses
492


Nearby investment properties with comparable rents
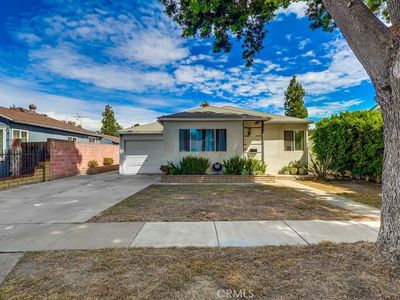
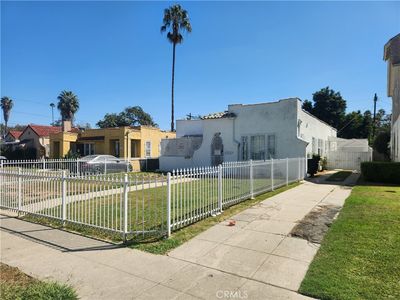
Nearby investment properties with comparable prices
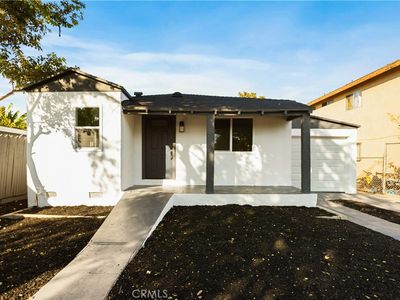

Ziffy AI Summary
A quick, investor-focused snapshot highlighting income strength, yield potential.
| Key metrics | Value |
|---|---|
| Price | $399,900 |
| Est. Rent | $3,200/mo |
| ROI | 18% |
- Attractive rent-to-price ratio for income stability
- Good fit for DSCR financing with healthy coverage
Single Family
Built in 1946
5,680 sqft lot
$N/A/sqft
No HOA
Neighborhood Data
Neighborhood data shown for ZIP Code: 90059, Los Angeles, CA area.
Housing Distribution
Housing Statistics
| Category | Value |
|---|---|
| Total HU (Housing Units) | 11,293 (100%) |
| Owner Occupied HU | 4,787 (42.4%) |
| Renter Occupied HU | 6,165 (54.6%) |
| Vacant Housing Units | 341 ( 3.0%) |
| Median Home Value | $606,528 |
| Average Home Value | $681,341 |
Housing Distribution
Address Breakdown
Residential
10,288
Single Family
9,532
Multi-Family
756
Businesses
492
Nearby investment properties with comparable rents
Nearby investment properties with comparable prices
Listed by: Tedra Godfrey • Nb Elite Realty
Mls Name: CCAR
Mls Provider:
Mls ID: #41107013
Disclaimer: CCAR 2025. Bay East 2025. bridgeMLS 2025. Information Deemed Reliable But Not Guaranteed. This information is being provided by the CCAR MLS, or Bay East MLS, or bridgeMLS. The listings presented here may or may not be listed by the Broker/Agent operating this website. This information is intended for the personal use of consumers and may not be used for any purpose other than to identify prospective properties consumers may be interested in purchasing. Data last updated at 2025-10-07 20:46:41 PDT