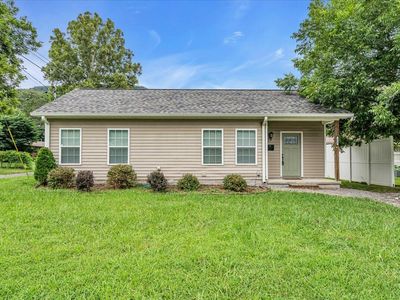
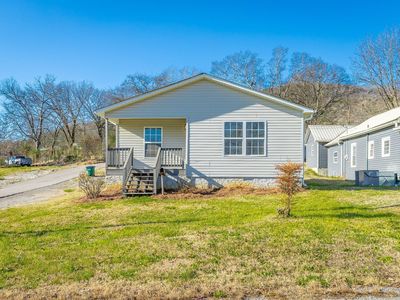
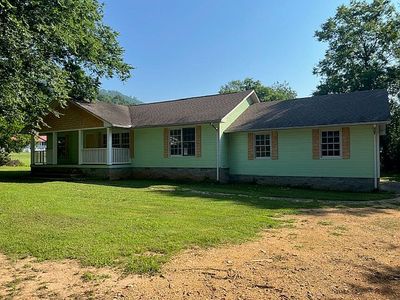
604 2nd StSouth PittsburgTN37380
INVESTMENT ANALYSIS
Investment Verdict
Strong Cash FlowFew South Pittsburg rentals match the income profile of 604 2nd St, South Pittsburg, TN, 37380. Listed at $180,000, gross rent is $1,625/mo and net cash flow is $547/mo, a 10.83% yield well above national averages. DSCR 2.01 means Ziffy Mortgage can approve your loan on the property's income alone, bypassing personal income verification. The 5% annual appreciation trend adds $49,731 by year five with $1,658/yr in annual principal reduction, projecting $103,387 in total cumulative return.
| This Property | National Avg | |
|---|---|---|
| Gross Rental Yield | 10.8% | 6.2% |
| Monthly Cash Flow | $547 | $180 |
National averages based on 2024–2025 U.S. residential rental market data. Content is user-generated and unverified.
DSCR Rental Loan Qualification
Qualifies using the property's rental income, not your personal income.
- ✓No W-2, pay stubs, or tax returns needed
- ✓Rental income qualifies you
- ✓Built for real estate investors
| Monthly Rental Income | $1,625 |
| Total Monthly Debt Service | $1,006 |
| DSCR Ratio | 1.62x |
Ziffy Mortgage: Your DSCR most likely meets our 1.0+ requirement, so you'll most probably qualify for our standard DSCR investment loan program. To pre-qualify, book time with your loan officer →
Estimates assume 6.0% rate / 30-yr fixed, 30% down, 1% tax, 0.5% insurance. Not a commitment to lend.
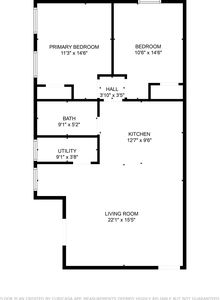
Single Family
Built in 2022
3,049 sqft lot
$N/A/sqft
No HOA
Neighborhood Data
Neighborhood data shown for ZIP Code: 37380, South Pittsburg, TN area.
Housing Distribution
Housing Statistics
| Category | Value |
|---|---|
| Total HU (Housing Units) | 3,023 (100%) |
| Owner Occupied HU | 1,920 (63.5%) |
| Renter Occupied HU | 726 (24.0%) |
| Vacant Housing Units | 377 (12.5%) |
| Median Home Value | $213,799 |
| Average Home Value | $256,471 |
Housing Distribution
Address Breakdown
Residential
2,855
Single Family
2,792
Multi-Family
63
Businesses
288


Nearby investment properties with comparable rents
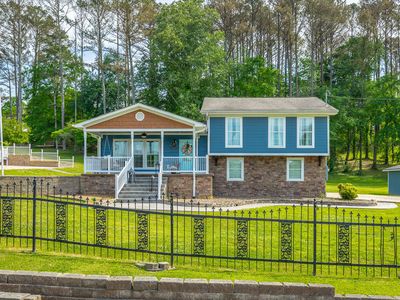
Nearby investment properties with comparable prices

Ziffy AI Summary
A quick, investor-focused snapshot highlighting income strength, yield potential.
| Key metrics | Value |
|---|---|
| Price | $399,900 |
| Est. Rent | $3,200/mo |
| ROI | 18% |
- Attractive rent-to-price ratio for income stability
- Good fit for DSCR financing with healthy coverage
Single Family
Built in 2022
3,049 sqft lot
$N/A/sqft
No HOA
Neighborhood Data
Neighborhood data shown for ZIP Code: 37380, South Pittsburg, TN area.
Housing Distribution
Housing Statistics
| Category | Value |
|---|---|
| Total HU (Housing Units) | 3,023 (100%) |
| Owner Occupied HU | 1,920 (63.5%) |
| Renter Occupied HU | 726 (24.0%) |
| Vacant Housing Units | 377 (12.5%) |
| Median Home Value | $213,799 |
| Average Home Value | $256,471 |
Housing Distribution
Address Breakdown
Residential
2,855
Single Family
2,792
Multi-Family
63
Businesses
288
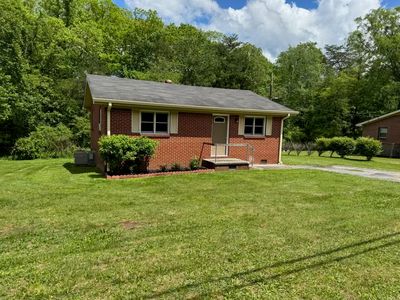
Nearby investment properties with comparable rents
Nearby investment properties with comparable prices
Listed by: Gina Pannell • RE/MAX Realty South
Mls Name: Greater Chattanooga Realtors
Mls ID: #1518381
Disclaimer: IDX information is provided exclusively for consumers personal, noncommercial use, that it may not be used for any purpose other than to identify prospective properties consumers may be interested in purchasing. Data is deemed reliable but is not guaranteed accurate by the MLS. Zillow, Inc. does not display the entire MLS of Chattanooga, Inc. database on this website. The listings of some real estate brokerage firms have been excluded. Some or all of the listings displayed may not belong to the firm whose website is being visited Copyright 2025 by Chattanooga Association of REALTORS