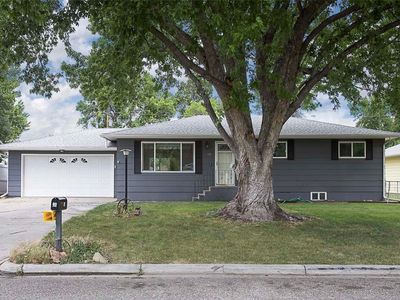
595 Chino CirBillingsMT59105

INVESTMENT ANALYSIS
Investment Verdict
Appreciation PlayMarkets with strong demand fundamentals often produce low-yield, high-appreciation assets. 595 Chino Cir, Billings, MT, 59105 in Billings fits: $418,300, 0% gross yield, and a projected 5% annual appreciation rate adding $115,569 in value within five years. Rental yield 0%. The narrow rent-to-debt spread is the trade-off for market growth. Ziffy Mortgage's DSCR loan (0.00) finances non-U.S. buyers without personal income documentation; optimise coverage with a 30–35% down payment. $3,853/yr in principal paydown and $115,569 in appreciation project a total return of $679.
| This Property | City Avg | |
|---|---|---|
| Gross Rental Yield | 0% | 6.0% |
| Monthly Cash Flow | $0 | $200 |
City averages based on Billings market data in our database. Property projections are estimates.
Home Type Unknown
Built in N/A
N/A lot
$N/A/sqft
No HOA
Neighborhood Data
Neighborhood data shown for ZIP Code: 59105, Billings, MT area.
Housing Distribution
Housing Statistics
| Category | Value |
|---|---|
| Total HU (Housing Units) | 14,483 (100%) |
| Owner Occupied HU | 9,860 (68.1%) |
| Renter Occupied HU | 3,815 (26.3%) |
| Vacant Housing Units | 808 ( 5.6%) |
| Median Home Value | $374,775 |
| Average Home Value | $409,000 |
Housing Distribution
Address Breakdown
Residential
13,800
Single Family
13,406
Multi-Family
394
Businesses
770


Nearby investment properties with comparable rents
No similar rental properties found nearby.
Nearby investment properties with comparable prices


Ziffy AI Summary
A quick, investor-focused snapshot highlighting income strength, yield potential.
| Key metrics | Value |
|---|---|
| Price | $399,900 |
| Est. Rent | $3,200/mo |
| ROI | 18% |
- Attractive rent-to-price ratio for income stability
- Good fit for DSCR financing with healthy coverage
Home Type Unknown
Built in N/A
N/A lot
$N/A/sqft
No HOA
Neighborhood Data
Neighborhood data shown for ZIP Code: 59105, Billings, MT area.
Housing Distribution
Housing Statistics
| Category | Value |
|---|---|
| Total HU (Housing Units) | 14,483 (100%) |
| Owner Occupied HU | 9,860 (68.1%) |
| Renter Occupied HU | 3,815 (26.3%) |
| Vacant Housing Units | 808 ( 5.6%) |
| Median Home Value | $374,775 |
| Average Home Value | $409,000 |
Housing Distribution
Address Breakdown
Residential
13,800
Single Family
13,406
Multi-Family
394
Businesses
770
Nearby investment properties with comparable rents
No similar rental properties found nearby.
Nearby investment properties with comparable prices