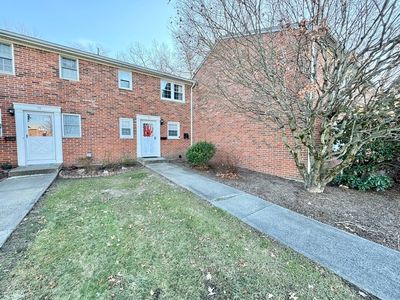
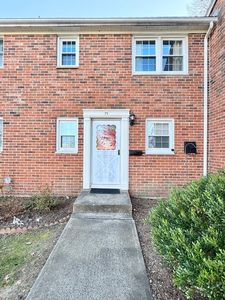
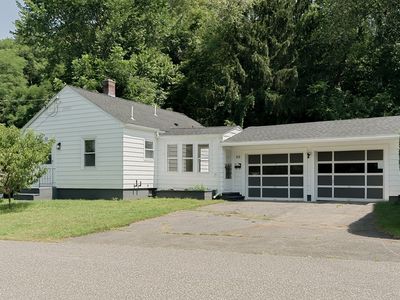
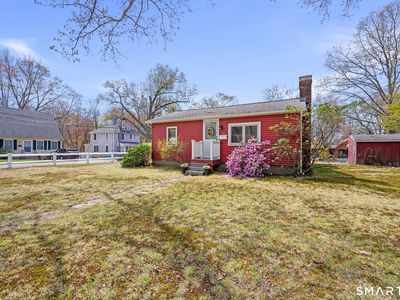
540 Granby Rd #71South HadleyMA01075
INVESTMENT ANALYSIS
Investment Verdict
Strong Cash FlowInvestors who value predictability will appreciate 540 Granby Rd #71, South Hadley, MA, 01075 in South Hadley. At $269,900 it earns $2,350/mo in rent and distributes $366/mo to the owner after the $1,214/mo payment, a consistent 10.45% yield. DSCR 1.94 clears Ziffy Mortgage's income-only underwriting standard. Over five years, 5% annual appreciation adds $74,568 in value; $2,486/yr in principal paydown compounds ownership stake. Total projected return: $127,280.
| This Property | City Avg | |
|---|---|---|
| Gross Rental Yield | 10.5% | 5.2% |
| Monthly Cash Flow | $366 | $350 |
City averages based on South Hadley market data in our database. Property projections are estimates.
DSCR Rental Loan Qualification
Qualifies using the property's rental income, not your personal income.
- ✓No W-2, pay stubs, or tax returns needed
- ✓Rental income qualifies you
- ✓Built for real estate investors
| Monthly Rental Income | $2,350 |
| Total Monthly Debt Service | $1,876 |
| DSCR Ratio | 1.25x |
Ziffy Mortgage: Your DSCR most likely meets our 1.0+ requirement, so you'll most probably qualify for our standard DSCR investment loan program. To pre-qualify, book time with your loan officer →
Estimates assume 6.0% rate / 30-yr fixed, 30% down, 1% tax, 0.5% insurance. Not a commitment to lend.
Townhouse
Built in 1969
N/A lot
$N/A/sqft
$282 monthly HOA
Neighborhood Data
Neighborhood data shown for ZIP Code: 01075, South Hadley, MA area.
Housing Distribution
Housing Statistics
| Category | Value |
|---|---|
| Total HU (Housing Units) | 7,562 (100%) |
| Owner Occupied HU | 5,395 (71.3%) |
| Renter Occupied HU | 1,814 (24.0%) |
| Vacant Housing Units | 353 ( 4.7%) |
| Median Home Value | $394,079 |
| Average Home Value | $438,698 |
Housing Distribution
Address Breakdown
Residential
7,165
Single Family
6,544
Multi-Family
621
Businesses
448


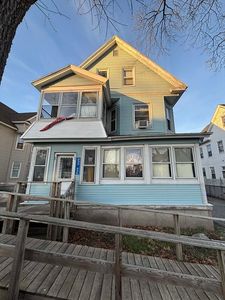
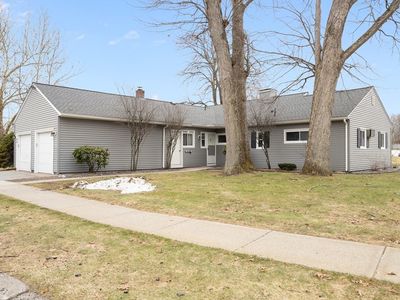
Nearby investment properties with comparable rents
Nearby investment properties with comparable prices

Ziffy AI Summary
A quick, investor-focused snapshot highlighting income strength, yield potential.
| Key metrics | Value |
|---|---|
| Price | $399,900 |
| Est. Rent | $3,200/mo |
| ROI | 18% |
- Attractive rent-to-price ratio for income stability
- Good fit for DSCR financing with healthy coverage
Townhouse
Built in 1969
N/A lot
$N/A/sqft
$282 monthly HOA
Neighborhood Data
Neighborhood data shown for ZIP Code: 01075, South Hadley, MA area.
Housing Distribution
Housing Statistics
| Category | Value |
|---|---|
| Total HU (Housing Units) | 7,562 (100%) |
| Owner Occupied HU | 5,395 (71.3%) |
| Renter Occupied HU | 1,814 (24.0%) |
| Vacant Housing Units | 353 ( 4.7%) |
| Median Home Value | $394,079 |
| Average Home Value | $438,698 |
Housing Distribution
Address Breakdown
Residential
7,165
Single Family
6,544
Multi-Family
621
Businesses
448
Nearby investment properties with comparable rents
Nearby investment properties with comparable prices