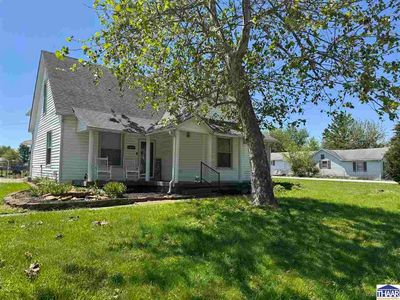
520 N Broad StSullivanIN47882
INVESTMENT ANALYSIS
Investment Verdict
Strong Cash FlowIf cash-on-cash performance is your primary filter, 520 N Broad St, Sullivan, IN, 47882 in Sullivan deserves attention. This $188,900 property earns $1,963/mo in rent, a 12.47% gross yield, and nets $829/mo after the $849/mo payment. DSCR 2.31 makes it one of the cleaner DSCR underwriting candidates Ziffy Mortgage sees in this market. Five-year appreciation of $52,190 compounds alongside $1,740/yr in yearly equity build, for a total cumulative return of $124,874.
| This Property | City Avg | |
|---|---|---|
| Gross Rental Yield | 12.5% | 6.0% |
| Monthly Cash Flow | $829 | $1,200 |
City averages based on Sullivan market data in our database. Property projections are estimates.
DSCR Rental Loan Qualification
Qualifies using the property's rental income, not your personal income.
- ✓No W-2, pay stubs, or tax returns needed
- ✓Rental income qualifies you
- ✓Built for real estate investors
| Monthly Rental Income | $1,963 |
| Total Monthly Debt Service | $1,059 |
| DSCR Ratio | 1.85x |
Ziffy Mortgage: Your DSCR most likely meets our 1.0+ requirement, so you'll most probably qualify for our standard DSCR investment loan program. To pre-qualify, book time with your loan officer →
Estimates assume 6.0% rate / 30-yr fixed, 30% down, 1% tax, 0.5% insurance. Not a commitment to lend.
Single Family
Built in 2023
4,550 sqft lot
$N/A/sqft
No HOA
Neighborhood Data
Neighborhood data shown for ZIP Code: 47882, Sullivan, IN area.
Housing Distribution
Housing Statistics
| Category | Value |
|---|---|
| Total HU (Housing Units) | 4,005 (100%) |
| Owner Occupied HU | 2,488 (62.1%) |
| Renter Occupied HU | 1,083 (27.0%) |
| Vacant Housing Units | 434 (10.8%) |
| Median Home Value | $146,466 |
| Average Home Value | $177,709 |
Housing Distribution
Address Breakdown
Residential
3,664
Single Family
3,451
Multi-Family
213
Businesses
313


Nearby investment properties with comparable rents


Nearby investment properties with comparable prices

Ziffy AI Summary
A quick, investor-focused snapshot highlighting income strength, yield potential.
| Key metrics | Value |
|---|---|
| Price | $399,900 |
| Est. Rent | $3,200/mo |
| ROI | 18% |
- Attractive rent-to-price ratio for income stability
- Good fit for DSCR financing with healthy coverage
Single Family
Built in 2023
4,550 sqft lot
$N/A/sqft
No HOA
Neighborhood Data
Neighborhood data shown for ZIP Code: 47882, Sullivan, IN area.
Housing Distribution
Housing Statistics
| Category | Value |
|---|---|
| Total HU (Housing Units) | 4,005 (100%) |
| Owner Occupied HU | 2,488 (62.1%) |
| Renter Occupied HU | 1,083 (27.0%) |
| Vacant Housing Units | 434 (10.8%) |
| Median Home Value | $146,466 |
| Average Home Value | $177,709 |
Housing Distribution
Address Breakdown
Residential
3,664
Single Family
3,451
Multi-Family
213
Businesses
313
Nearby investment properties with comparable rents
Nearby investment properties with comparable prices