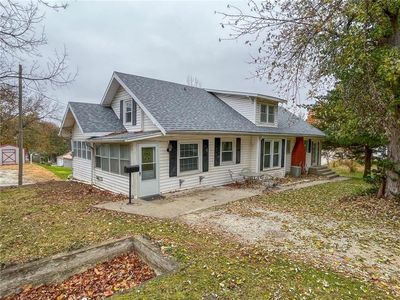
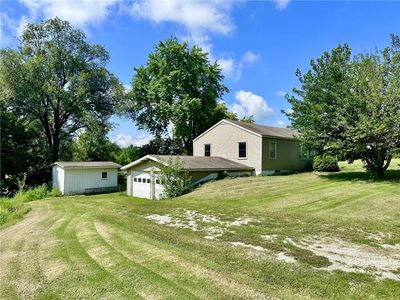
512 W 11th StTrentonMO64683
INVESTMENT ANALYSIS
Investment Verdict
Appreciation PlayMarkets with strong demand fundamentals often produce low-yield, high-appreciation assets. 512 W 11th St, Trenton, MO, 64683 in Trenton fits: $104,900, 0% gross yield, and a projected 5% annual appreciation rate adding $28,982 in value within five years. Rental yield 0%. The narrow rent-to-debt spread is the trade-off for market growth. Ziffy Mortgage's DSCR loan (0.00) finances non-U.S. buyers without personal income documentation; optimise coverage with a 30–35% down payment.
| This Property | National Avg | |
|---|---|---|
| Gross Rental Yield | 0% | 6.2% |
| Monthly Cash Flow | $0 | $180 |
National averages based on 2024–2025 U.S. residential rental market data. Content is user-generated and unverified.
Single Family
Built in 1925
10,018 sqft lot
$N/A/sqft
No HOA
Neighborhood Data
Neighborhood data shown for ZIP Code: 64683, Trenton, MO area.
Housing Distribution
Housing Statistics
| Category | Value |
|---|---|
| Total HU (Housing Units) | 3,962 (100%) |
| Owner Occupied HU | 2,302 (58.1%) |
| Renter Occupied HU | 964 (24.3%) |
| Vacant Housing Units | 696 (17.6%) |
| Median Home Value | $141,060 |
| Average Home Value | $207,402 |
Housing Distribution
Address Breakdown
Residential
3,543
Single Family
3,509
Multi-Family
34
Businesses
363


Nearby investment properties with comparable rents
No similar rental properties found nearby.
Nearby investment properties with comparable prices

Ziffy AI Summary
A quick, investor-focused snapshot highlighting income strength, yield potential.
| Key metrics | Value |
|---|---|
| Price | $399,900 |
| Est. Rent | $3,200/mo |
| ROI | 18% |
- Attractive rent-to-price ratio for income stability
- Good fit for DSCR financing with healthy coverage
Single Family
Built in 1925
10,018 sqft lot
$N/A/sqft
No HOA
Neighborhood Data
Neighborhood data shown for ZIP Code: 64683, Trenton, MO area.
Housing Distribution
Housing Statistics
| Category | Value |
|---|---|
| Total HU (Housing Units) | 3,962 (100%) |
| Owner Occupied HU | 2,302 (58.1%) |
| Renter Occupied HU | 964 (24.3%) |
| Vacant Housing Units | 696 (17.6%) |
| Median Home Value | $141,060 |
| Average Home Value | $207,402 |
Housing Distribution
Address Breakdown
Residential
3,543
Single Family
3,509
Multi-Family
34
Businesses
363
Nearby investment properties with comparable rents
No similar rental properties found nearby.
Nearby investment properties with comparable prices