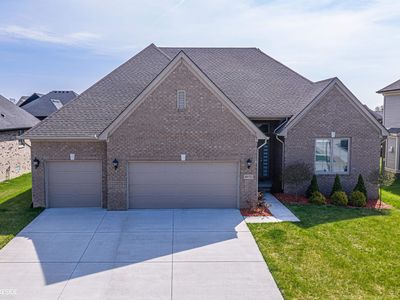
49712 Split Rock RdMacombMI48044
INVESTMENT ANALYSIS
Investment Verdict
Appreciation PlayInvestors who prioritise long-run asset value over immediate income should consider 49712 Split Rock Rd, Macomb, MI, 48044 in Macomb. Rental yield 3.23%. At $550,000 with 3.23% gross yield, current distributions are modest, but the 5% appreciation rate projects $151,955 in new equity by year five, complemented by $5,066/yr in principal paydown. Ziffy Mortgage's DSCR loan (0.60) allows non-U.S. residents to acquire without W-2s or domestic credit. Total projected five-year cumulative return: $71,502.
| This Property | City Avg | |
|---|---|---|
| Gross Rental Yield | 3.2% | 6.2% |
| Monthly Cash Flow | $(2,178) | $320 |
City averages based on Macomb market data in our database. Property projections are estimates.
DSCR Rental Loan Qualification
Qualifies using the property's rental income, not your personal income.
- ✓No W-2, pay stubs, or tax returns needed
- ✓Rental income qualifies you
- ✓Built for real estate investors
| Monthly Rental Income | $1,482 |
| Total Monthly Debt Service | $3,408 |
| DSCR Ratio | 0.43x |
Ziffy Mortgage typically prefers a DSCR of 1.0+, but in some cases you may qualify with a DSCR below 1. To explore if this deal qualifies for an investment mortgage, book time with your loan officer →
Estimates assume 6.0% rate / 30-yr fixed, 30% down, 1% tax, 0.5% insurance. Not a commitment to lend.
Single Family
Built in 2021
8,712 sqft lot
$N/A/sqft
No HOA
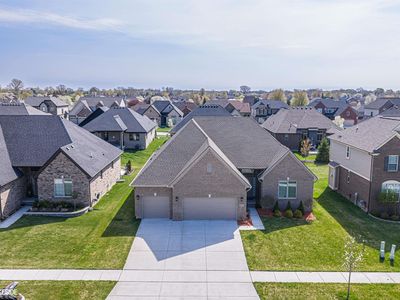
Neighborhood Data
Neighborhood data shown for ZIP Code: 48044, Macomb, MI area.
Housing Distribution
Housing Statistics
| Category | Value |
|---|---|
| Total HU (Housing Units) | 20,325 (100%) |
| Owner Occupied HU | 18,201 (89.5%) |
| Renter Occupied HU | 1,855 ( 9.1%) |
| Vacant Housing Units | 269 ( 1.3%) |
| Median Home Value | $352,340 |
| Average Home Value | $355,760 |
Housing Distribution
Address Breakdown
Residential
20,629
Single Family
20,025
Multi-Family
604
Businesses
434


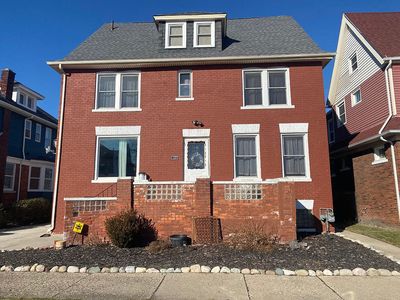
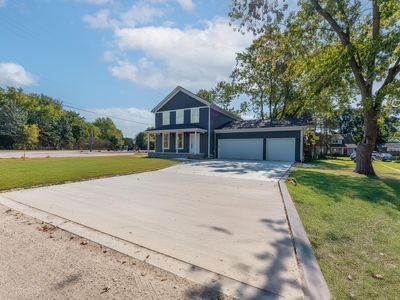
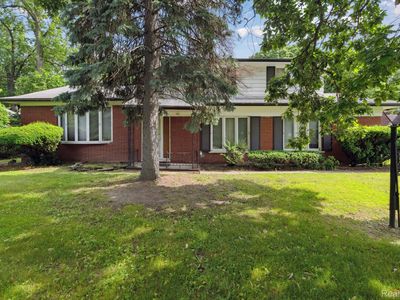
Nearby investment properties with comparable rents
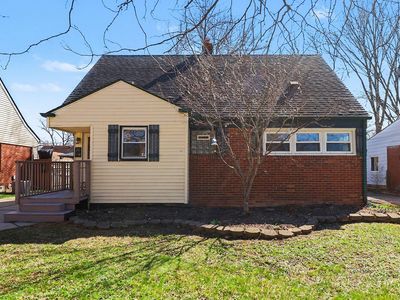
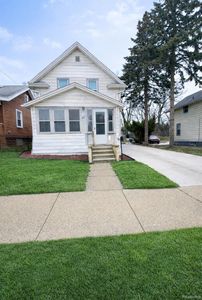
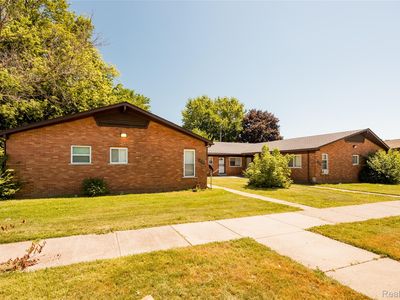
Nearby investment properties with comparable prices
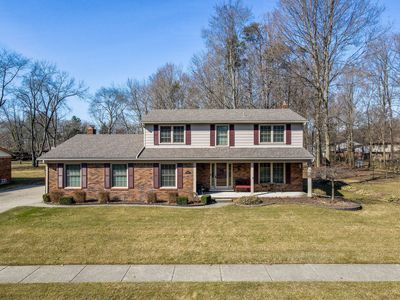

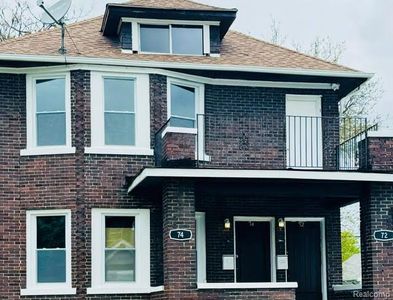
Ziffy AI Summary
A quick, investor-focused snapshot highlighting income strength, yield potential.
| Key metrics | Value |
|---|---|
| Price | $399,900 |
| Est. Rent | $3,200/mo |
| ROI | 18% |
- Attractive rent-to-price ratio for income stability
- Good fit for DSCR financing with healthy coverage
Single Family
Built in 2021
8,712 sqft lot
$N/A/sqft
No HOA
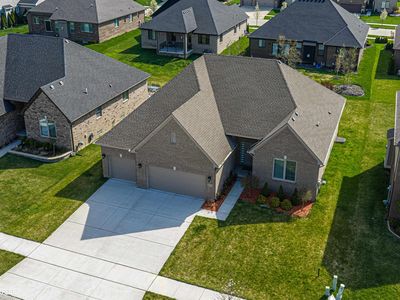
Neighborhood Data
Neighborhood data shown for ZIP Code: 48044, Macomb, MI area.
Housing Distribution
Housing Statistics
| Category | Value |
|---|---|
| Total HU (Housing Units) | 20,325 (100%) |
| Owner Occupied HU | 18,201 (89.5%) |
| Renter Occupied HU | 1,855 ( 9.1%) |
| Vacant Housing Units | 269 ( 1.3%) |
| Median Home Value | $352,340 |
| Average Home Value | $355,760 |
Housing Distribution
Address Breakdown
Residential
20,629
Single Family
20,025
Multi-Family
604
Businesses
434
Nearby investment properties with comparable rents
Nearby investment properties with comparable prices