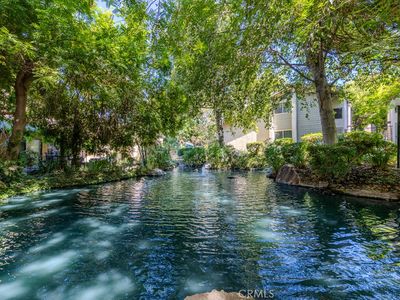
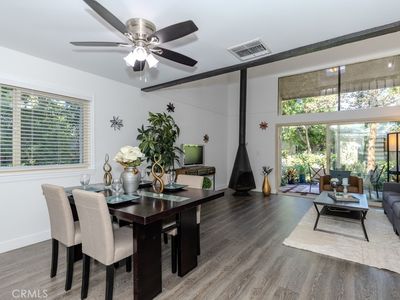
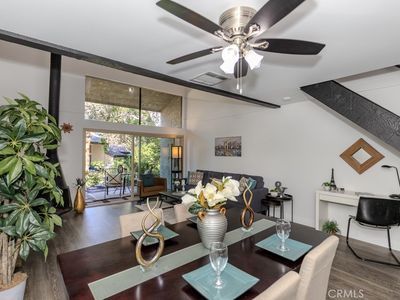
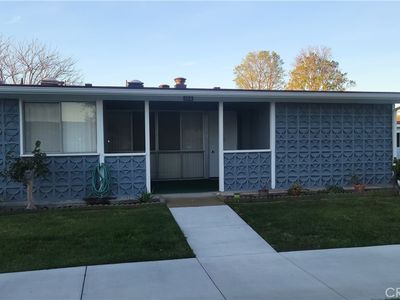
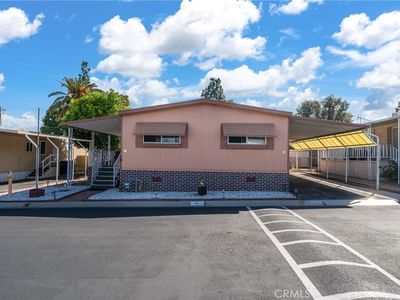
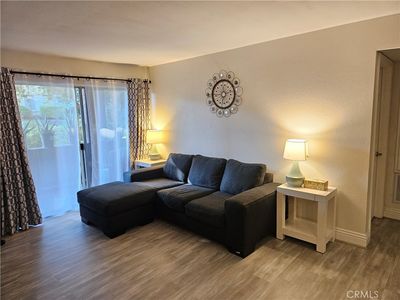
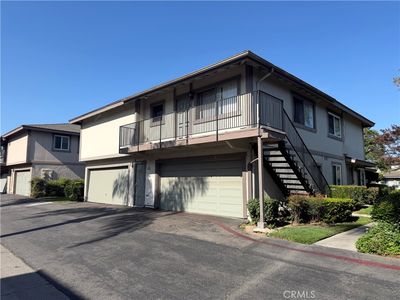
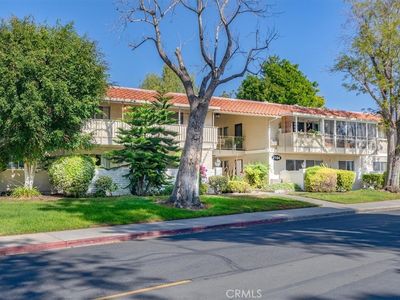
4900 E Chapman Ave UNIT 86OrangeCA92869
INVESTMENT ANALYSIS
Investment Verdict
Steady Equity Builder4900 E Chapman Ave UNIT 86, Orange, CA, 92869 in Orange earns a respectable 7.54% gross yield at $467,000, but after the $2,100/mo mortgage the net cash flow is $45/mo, a tight but positive spread. Expense discipline (vacancy, management, maintenance) will determine whether the margin widens. Ziffy Mortgage's DSCR mortgage (1.40) still qualifies on property income; a larger down payment can improve the cash-flow buffer. Long-term, 5% appreciation projects $129,023 over five years, making equity the dominant return driver. Total projected return: $179,979.
| This Property | City Avg | |
|---|---|---|
| Gross Rental Yield | 7.5% | 5.2% |
| Monthly Cash Flow | $45 | $1,200 |
City averages based on Orange market data in our database. Property projections are estimates.
DSCR Rental Loan Qualification
Qualifies using the property's rental income, not your personal income.
- ✓No W-2, pay stubs, or tax returns needed
- ✓Rental income qualifies you
- ✓Built for real estate investors
| Monthly Rental Income | $2,934 |
| Total Monthly Debt Service | $2,703 |
| DSCR Ratio | 1.09x |
Ziffy Mortgage: Your DSCR most likely meets our 1.0+ requirement, so you'll most probably qualify for our standard DSCR investment loan program. To pre-qualify, book time with your loan officer →
Estimates assume 6.0% rate / 30-yr fixed, 30% down, 1% tax, 0.5% insurance. Not a commitment to lend.
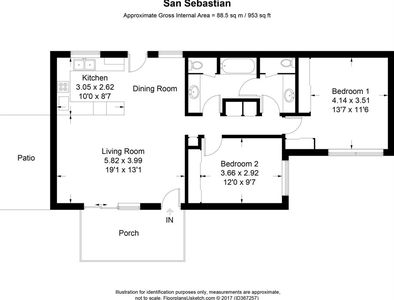
Townhouse
Built in 1976
954 sqft lot
$N/A/sqft
No HOA
Neighborhood Data
Neighborhood data shown for ZIP Code: 92869, Orange, CA area.
Housing Distribution
Housing Statistics
| Category | Value |
|---|---|
| Total HU (Housing Units) | 12,095 (100%) |
| Owner Occupied HU | 8,872 (73.4%) |
| Renter Occupied HU | 2,940 (24.3%) |
| Vacant Housing Units | 283 ( 2.3%) |
| Median Home Value | $1,072,388 |
| Average Home Value | $1,183,430 |
Housing Distribution
Address Breakdown
Residential
12,088
Single Family
10,537
Multi-Family
1,551
Businesses
428


Nearby investment properties with comparable rents
Nearby investment properties with comparable prices

Ziffy AI Summary
A quick, investor-focused snapshot highlighting income strength, yield potential.
| Key metrics | Value |
|---|---|
| Price | $399,900 |
| Est. Rent | $3,200/mo |
| ROI | 18% |
- Attractive rent-to-price ratio for income stability
- Good fit for DSCR financing with healthy coverage
Townhouse
Built in 1976
954 sqft lot
$N/A/sqft
No HOA
Neighborhood Data
Neighborhood data shown for ZIP Code: 92869, Orange, CA area.
Housing Distribution
Housing Statistics
| Category | Value |
|---|---|
| Total HU (Housing Units) | 12,095 (100%) |
| Owner Occupied HU | 8,872 (73.4%) |
| Renter Occupied HU | 2,940 (24.3%) |
| Vacant Housing Units | 283 ( 2.3%) |
| Median Home Value | $1,072,388 |
| Average Home Value | $1,183,430 |
Housing Distribution
Address Breakdown
Residential
12,088
Single Family
10,537
Multi-Family
1,551
Businesses
428
Nearby investment properties with comparable rents
Nearby investment properties with comparable prices
Listed by: Paul Armas • Realty One Group West
Mls Name: CRMLS
Mls ID: #PW25196669