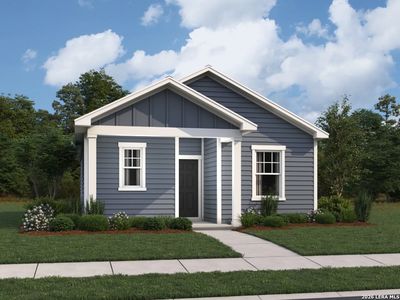
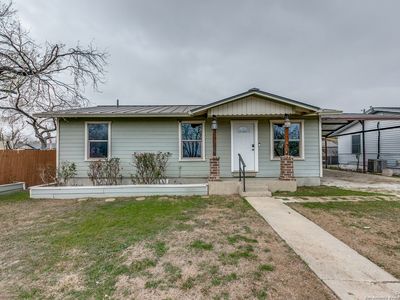
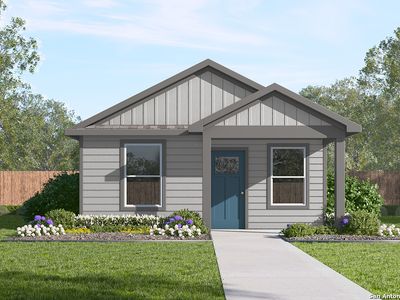
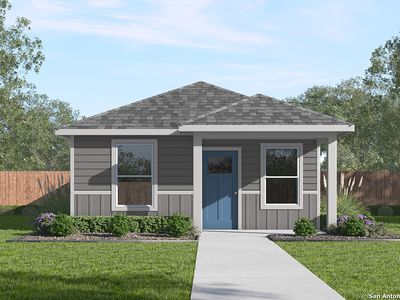
4627 Flying HoovesSan AntonioTX78222
INVESTMENT ANALYSIS
Investment Verdict
Strong Cash FlowThis is a cash-flow-light asset: 4627 Flying Hooves, San Antonio, TX, 78222 in San Antonio, $189,900, 10.01% gross yield, $196/mo net income. Consider it a market-entry position, the $1,584/mo rent covers the $854/mo payment with a margin, and 5%/yr appreciation is projected to add $52,466 to the asset's value over five years. Ziffy Mortgage approves DSCR loans (coverage 1.85) for non-U.S. residents without domestic income documentation. Consider a higher down payment to widen the monthly margin. Total projected return: $85,566.
| This Property | City Avg | |
|---|---|---|
| Gross Rental Yield | 10% | 5.8% |
| Monthly Cash Flow | $196 | $450 |
City averages based on San Antonio market data in our database. Property projections are estimates.
DSCR Rental Loan Qualification
Qualifies using the property's rental income, not your personal income.
- ✓No W-2, pay stubs, or tax returns needed
- ✓Rental income qualifies you
- ✓Built for real estate investors
| Monthly Rental Income | $1,584 |
| Total Monthly Debt Service | $1,312 |
| DSCR Ratio | 1.21x |
Ziffy Mortgage: Your DSCR most likely meets our 1.0+ requirement, so you'll most probably qualify for our standard DSCR investment loan program. To pre-qualify, book time with your loan officer →
Estimates assume 6.0% rate / 30-yr fixed, 30% down, 1% tax, 0.5% insurance. Not a commitment to lend.
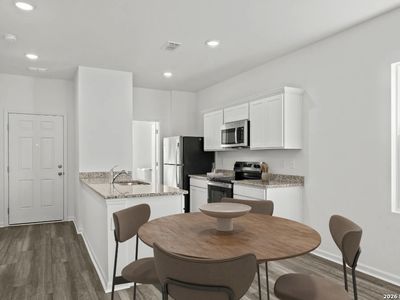
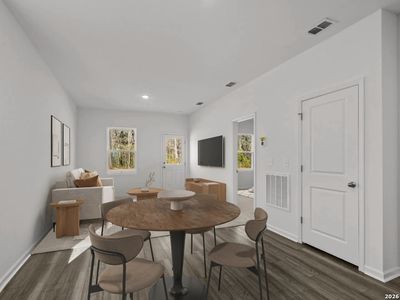
Single Family
Built in 2026
5,227 sqft lot
$N/A/sqft
$450 annually HOA
Neighborhood Data
Neighborhood data shown for ZIP Code: 78222, San Antonio, TX area.
Housing Distribution
Housing Statistics
| Category | Value |
|---|---|
| Total HU (Housing Units) | 9,456 (100%) |
| Owner Occupied HU | 6,594 (69.7%) |
| Renter Occupied HU | 2,278 (24.1%) |
| Vacant Housing Units | 584 ( 6.2%) |
| Median Home Value | $240,405 |
| Average Home Value | $264,732 |
Housing Distribution
Address Breakdown
Residential
10,045
Single Family
8,655
Multi-Family
1,390
Businesses
388


Nearby investment properties with comparable rents
Nearby investment properties with comparable prices


Ziffy AI Summary
A quick, investor-focused snapshot highlighting income strength, yield potential.
| Key metrics | Value |
|---|---|
| Price | $399,900 |
| Est. Rent | $3,200/mo |
| ROI | 18% |
- Attractive rent-to-price ratio for income stability
- Good fit for DSCR financing with healthy coverage
Single Family
Built in 2026
5,227 sqft lot
$N/A/sqft
$450 annually HOA
Neighborhood Data
Neighborhood data shown for ZIP Code: 78222, San Antonio, TX area.
Housing Distribution
Housing Statistics
| Category | Value |
|---|---|
| Total HU (Housing Units) | 9,456 (100%) |
| Owner Occupied HU | 6,594 (69.7%) |
| Renter Occupied HU | 2,278 (24.1%) |
| Vacant Housing Units | 584 ( 6.2%) |
| Median Home Value | $240,405 |
| Average Home Value | $264,732 |
Housing Distribution
Address Breakdown
Residential
10,045
Single Family
8,655
Multi-Family
1,390
Businesses
388
Nearby investment properties with comparable rents
Nearby investment properties with comparable prices
Listed by: Cesar Amezcua • CA & Company, REALTORS
Mls Name: LERA MLS
Mls Provider:
Mls ID: #1960669
Disclaimer: IDX information is provided exclusively for personal, non-commercial use, and may not be used for any purpose other than to identify prospective properties consumers may be interested in purchasing. Information is deemed reliable but not guaranteed.