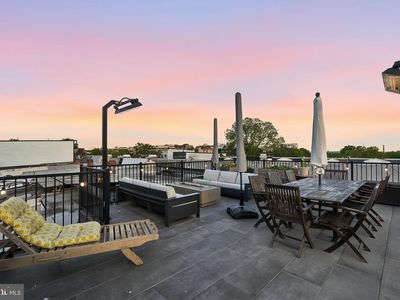
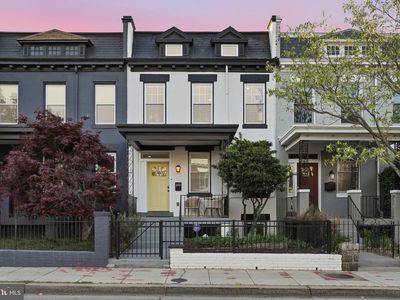
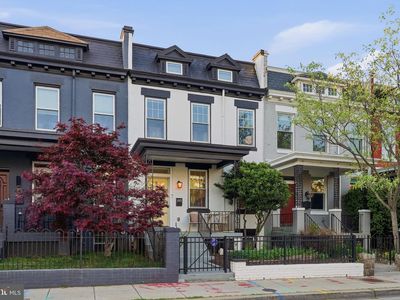
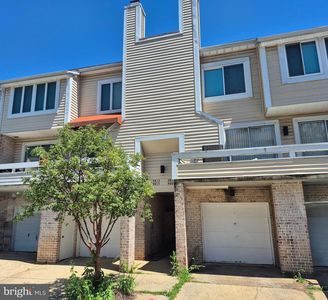
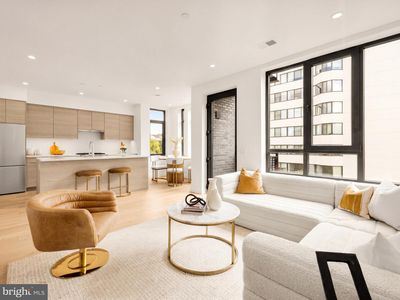
445 Kenyon St NWWashingtonDC20010
INVESTMENT ANALYSIS
Investment Verdict
Appreciation PlayThe investment thesis at 445 Kenyon St NW, Washington, DC, 20010 in Washington is capital appreciation. Rental yield 4.5%. The 4.5% gross yield at $1,099,000 falls below cash-flow thresholds, but 5% annual value growth is forecast to deliver $303,633 in additional equity by year five, an equity gain that can outpace many higher-yield markets. Ziffy Mortgage finances appreciation-play assets via DSCR (0.83) without U.S. credit history; structure with a larger down payment to optimise coverage. Total projected return: $266,371.
| This Property | City Avg | |
|---|---|---|
| Gross Rental Yield | 4.5% | 5.2% |
| Monthly Cash Flow | $(2,311) | $1,200 |
City averages based on Washington market data in our database. Property projections are estimates.
DSCR Rental Loan Qualification
Qualifies using the property's rental income, not your personal income.
- ✓No W-2, pay stubs, or tax returns needed
- ✓Rental income qualifies you
- ✓Built for real estate investors
| Monthly Rental Income | $4,121 |
| Total Monthly Debt Service | $5,995 |
| DSCR Ratio | 0.69x |
Ziffy Mortgage typically prefers a DSCR of 1.0+, but in some cases you may qualify with a DSCR below 1. To explore if this deal qualifies for an investment mortgage, book time with your loan officer →
Estimates assume 6.0% rate / 30-yr fixed, 30% down, 1% tax, 0.5% insurance. Not a commitment to lend.
Townhouse
Built in 1914
1,700 sqft lot
$N/A/sqft
No HOA
Neighborhood Data
Neighborhood data shown for ZIP Code: 20010, Washington, DC area.
Housing Distribution
Housing Statistics
| Category | Value |
|---|---|
| Total HU (Housing Units) | 14,885 (100%) |
| Owner Occupied HU | 4,717 (31.7%) |
| Renter Occupied HU | 9,131 (61.3%) |
| Vacant Housing Units | 1,037 ( 7.0%) |
| Median Home Value | $876,050 |
| Average Home Value | $937,564 |
Housing Distribution
Address Breakdown
Residential
14,553
Single Family
5,689
Multi-Family
8,864
Businesses
610


Nearby investment properties with comparable rents
Nearby investment properties with comparable prices

Ziffy AI Summary
A quick, investor-focused snapshot highlighting income strength, yield potential.
| Key metrics | Value |
|---|---|
| Price | $399,900 |
| Est. Rent | $3,200/mo |
| ROI | 18% |
- Attractive rent-to-price ratio for income stability
- Good fit for DSCR financing with healthy coverage
Townhouse
Built in 1914
1,700 sqft lot
$N/A/sqft
No HOA
Neighborhood Data
Neighborhood data shown for ZIP Code: 20010, Washington, DC area.
Housing Distribution
Housing Statistics
| Category | Value |
|---|---|
| Total HU (Housing Units) | 14,885 (100%) |
| Owner Occupied HU | 4,717 (31.7%) |
| Renter Occupied HU | 9,131 (61.3%) |
| Vacant Housing Units | 1,037 ( 7.0%) |
| Median Home Value | $876,050 |
| Average Home Value | $937,564 |
Housing Distribution
Address Breakdown
Residential
14,553
Single Family
5,689
Multi-Family
8,864
Businesses
610
Nearby investment properties with comparable rents
Nearby investment properties with comparable prices
Listed by: N/A • N/A
Mls Name: Bright MLS
Mls ID: #DCDC2258078