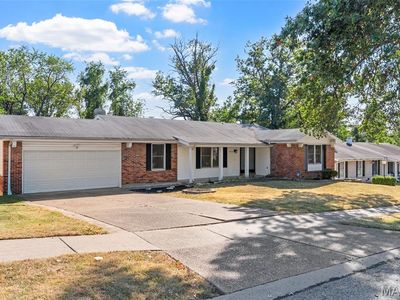
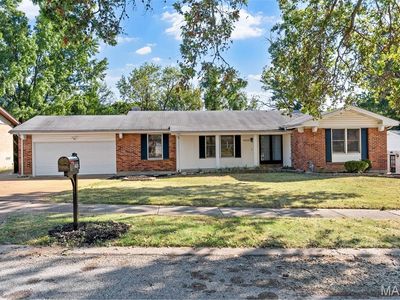
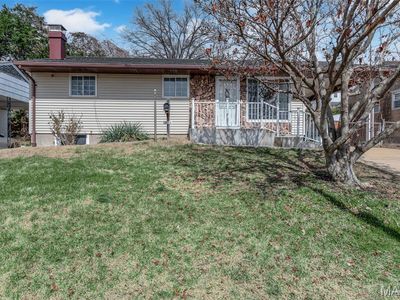
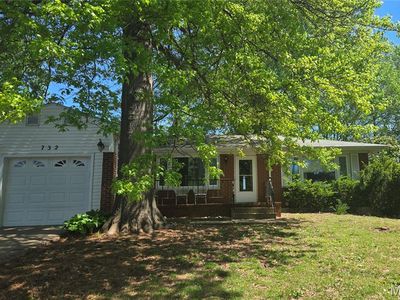
4424 Cloverbrook DrBlack JackMO63033
INVESTMENT ANALYSIS
Investment Verdict
Solid IncomeReliable, bankable, and well-priced, 4424 Cloverbrook Dr, Black Jack, MO, 63033 in Black Jack delivers $1,914/mo in gross rent and $332/mo in net monthly income at a $254,000 entry. The 9.04% yield and 1.68 DSCR make it a clean candidate for Ziffy Mortgage's DSCR loan; no W-2s or U.S. credit history required. With 5% annual appreciation projecting $70,176 over five years and $2,339/yr in equity from loan paydown, total projected return is $117,763.
| This Property | National Avg | |
|---|---|---|
| Gross Rental Yield | 9% | 6.2% |
| Monthly Cash Flow | $332 | $180 |
National averages based on 2024–2025 U.S. residential rental market data. Content is user-generated and unverified.
DSCR Rental Loan Qualification
Qualifies using the property's rental income, not your personal income.
- ✓No W-2, pay stubs, or tax returns needed
- ✓Rental income qualifies you
- ✓Built for real estate investors
| Monthly Rental Income | $1,914 |
| Total Monthly Debt Service | $1,481 |
| DSCR Ratio | 1.29x |
Ziffy Mortgage: Your DSCR most likely meets our 1.0+ requirement, so you'll most probably qualify for our standard DSCR investment loan program. To pre-qualify, book time with your loan officer →
Estimates assume 6.0% rate / 30-yr fixed, 30% down, 1% tax, 0.5% insurance. Not a commitment to lend.
Single Family
Built in 1972
0.28 Acres lot
$N/A/sqft
No HOA
Neighborhood Data
Neighborhood data shown for ZIP Code: 63033, Florissant, MO area.
Housing Distribution
Housing Statistics
| Category | Value |
|---|---|
| Total HU (Housing Units) | 18,341 (100%) |
| Owner Occupied HU | 10,869 (59.3%) |
| Renter Occupied HU | 5,935 (32.4%) |
| Vacant Housing Units | 1,537 ( 8.4%) |
| Median Home Value | $164,599 |
| Average Home Value | $182,286 |
Housing Distribution
Address Breakdown
Residential
17,409
Single Family
14,466
Multi-Family
2,943
Businesses
639


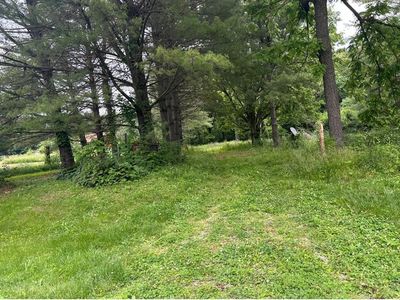
Nearby investment properties with comparable rents
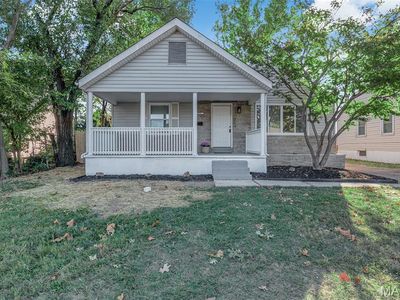
Nearby investment properties with comparable prices
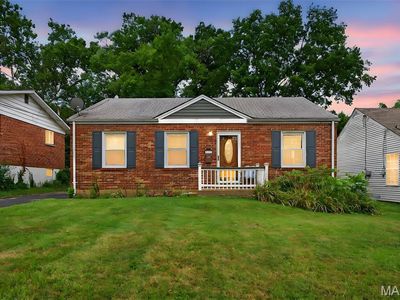
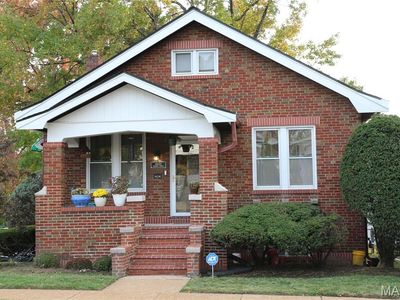

Ziffy AI Summary
A quick, investor-focused snapshot highlighting income strength, yield potential.
| Key metrics | Value |
|---|---|
| Price | $399,900 |
| Est. Rent | $3,200/mo |
| ROI | 18% |
- Attractive rent-to-price ratio for income stability
- Good fit for DSCR financing with healthy coverage
Single Family
Built in 1972
0.28 Acres lot
$N/A/sqft
No HOA
Neighborhood Data
Neighborhood data shown for ZIP Code: 63033, Florissant, MO area.
Housing Distribution
Housing Statistics
| Category | Value |
|---|---|
| Total HU (Housing Units) | 18,341 (100%) |
| Owner Occupied HU | 10,869 (59.3%) |
| Renter Occupied HU | 5,935 (32.4%) |
| Vacant Housing Units | 1,537 ( 8.4%) |
| Median Home Value | $164,599 |
| Average Home Value | $182,286 |
Housing Distribution
Address Breakdown
Residential
17,409
Single Family
14,466
Multi-Family
2,943
Businesses
639
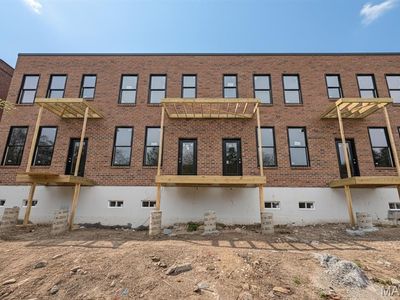
Nearby investment properties with comparable rents
Nearby investment properties with comparable prices
Listed by: Brysan V DuVall • EXP Realty, LLC
Mls Name: MARIS
Mls ID: #25065931