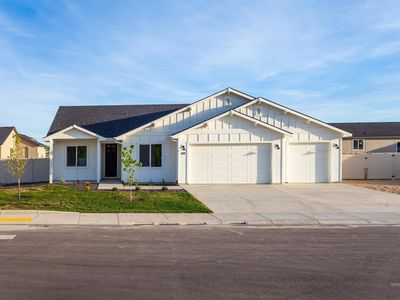
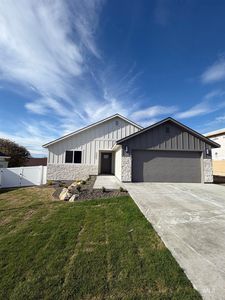
439 Autumn Blaze StNew PlymouthID83655
INVESTMENT ANALYSIS
Investment Verdict
Appreciation PlayThe investment thesis at 439 Autumn Blaze St, New Plymouth, ID, 83655 in New Plymouth is capital appreciation. Rental yield 0%. The 0% gross yield at $433,500 falls below cash-flow thresholds, but 5% annual value growth is forecast to deliver $119,768 in additional equity by year five, an equity gain that can outpace many higher-yield markets. Ziffy Mortgage finances appreciation-play assets via DSCR (0.00) without U.S. credit history; structure with a larger down payment to optimise coverage. Total projected return: $1,110.
| This Property | City Avg | |
|---|---|---|
| Gross Rental Yield | 0% | 6.5% |
| Monthly Cash Flow | $0 | $350 |
City averages based on New Plymouth market data in our database. Property projections are estimates.
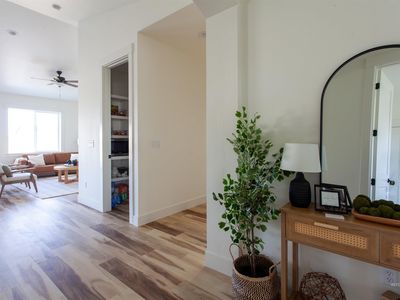
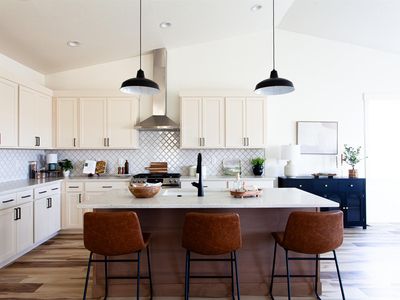
Single Family
Built in 2024
10,018 sqft lot
$N/A/sqft
$405 annually HOA
Neighborhood Data
Neighborhood data shown for ZIP Code: 83655, New Plymouth, ID area.
Housing Distribution
Housing Statistics
| Category | Value |
|---|---|
| Total HU (Housing Units) | 1,886 (100%) |
| Owner Occupied HU | 1,491 (79.1%) |
| Renter Occupied HU | 314 (16.6%) |
| Vacant Housing Units | 81 ( 4.3%) |
| Median Home Value | $402,951 |
| Average Home Value | $482,701 |
Housing Distribution
Address Breakdown
Residential
1,622
Single Family
1,622
Multi-Family
0
Businesses
97


Nearby investment properties with comparable rents
No similar rental properties found nearby.
Nearby investment properties with comparable prices
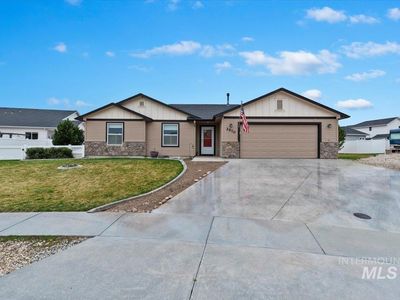

Ziffy AI Summary
A quick, investor-focused snapshot highlighting income strength, yield potential.
| Key metrics | Value |
|---|---|
| Price | $399,900 |
| Est. Rent | $3,200/mo |
| ROI | 18% |
- Attractive rent-to-price ratio for income stability
- Good fit for DSCR financing with healthy coverage
Single Family
Built in 2024
10,018 sqft lot
$N/A/sqft
$405 annually HOA
Neighborhood Data
Neighborhood data shown for ZIP Code: 83655, New Plymouth, ID area.
Housing Distribution
Housing Statistics
| Category | Value |
|---|---|
| Total HU (Housing Units) | 1,886 (100%) |
| Owner Occupied HU | 1,491 (79.1%) |
| Renter Occupied HU | 314 (16.6%) |
| Vacant Housing Units | 81 ( 4.3%) |
| Median Home Value | $402,951 |
| Average Home Value | $482,701 |
Housing Distribution
Address Breakdown
Residential
1,622
Single Family
1,622
Multi-Family
0
Businesses
97
Nearby investment properties with comparable rents
No similar rental properties found nearby.
Nearby investment properties with comparable prices