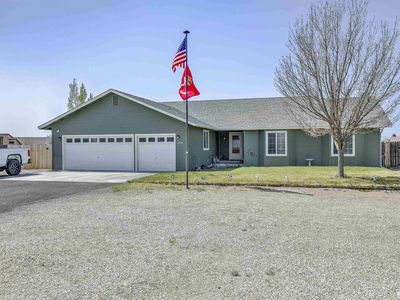
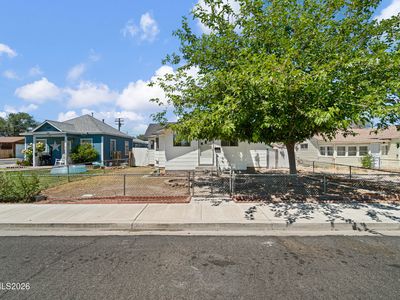
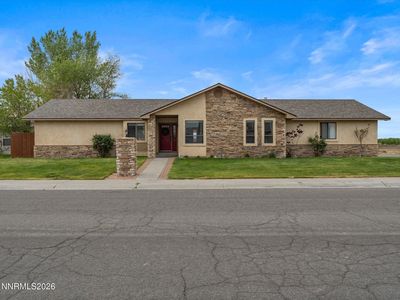
4233 Pelican DrFallonNV89406

INVESTMENT ANALYSIS
Investment Verdict
Appreciation PlayGlobal investors willing to prioritise equity over near-term yield will find 4233 Pelican Dr, Fallon, NV, 89406 in Fallon worth study. Rental yield 5.81%. The 5.81% gross yield is below cash-flow benchmarks at $545,000, but 5% annual appreciation, adding $150,573 over five years, frames this as a capital growth position. Rent of $2,640/mo partially offsets the $2,451/mo payment. Ziffy Mortgage finances appreciation-play properties (1.08 DSCR) for non-U.S. residents without domestic income documentation; a 30–35% down payment maximises coverage. Total projected return: $172,916.
| This Property | City Avg | |
|---|---|---|
| Gross Rental Yield | 5.8% | 6.8% |
| Monthly Cash Flow | $(509) | $420 |
City averages based on Fallon market data in our database. Property projections are estimates.
DSCR Rental Loan Qualification
Qualifies using the property's rental income, not your personal income.
- ✓No W-2, pay stubs, or tax returns needed
- ✓Rental income qualifies you
- ✓Built for real estate investors
| Monthly Rental Income | $2,640 |
| Total Monthly Debt Service | $2,932 |
| DSCR Ratio | 0.90x |
Ziffy Mortgage typically prefers a DSCR of 1.0+, but in some cases you may qualify with a DSCR below 1. To explore if this deal qualifies for an investment mortgage, book time with your loan officer →
Estimates assume 6.0% rate / 30-yr fixed, 30% down, 1% tax, 0.5% insurance. Not a commitment to lend.
Single Family
Built in 2004
1.18 Acres lot
$N/A/sqft
No HOA
Neighborhood Data
Neighborhood data shown for ZIP Code: 89406, Fallon, NV area.
Housing Distribution
Housing Statistics
| Category | Value |
|---|---|
| Total HU (Housing Units) | 10,944 (100%) |
| Owner Occupied HU | 7,143 (65.3%) |
| Renter Occupied HU | 3,088 (28.2%) |
| Vacant Housing Units | 713 ( 6.5%) |
| Median Home Value | $348,818 |
| Average Home Value | $377,633 |
Housing Distribution
Address Breakdown
Residential
10,701
Single Family
10,425
Multi-Family
276
Businesses
685


Nearby investment properties with comparable rents
Nearby investment properties with comparable prices
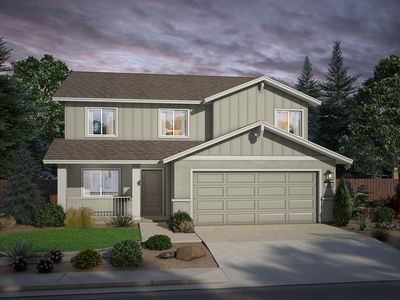

Ziffy AI Summary
A quick, investor-focused snapshot highlighting income strength, yield potential.
| Key metrics | Value |
|---|---|
| Price | $399,900 |
| Est. Rent | $3,200/mo |
| ROI | 18% |
- Attractive rent-to-price ratio for income stability
- Good fit for DSCR financing with healthy coverage
Single Family
Built in 2004
1.18 Acres lot
$N/A/sqft
No HOA
Neighborhood Data
Neighborhood data shown for ZIP Code: 89406, Fallon, NV area.
Housing Distribution
Housing Statistics
| Category | Value |
|---|---|
| Total HU (Housing Units) | 10,944 (100%) |
| Owner Occupied HU | 7,143 (65.3%) |
| Renter Occupied HU | 3,088 (28.2%) |
| Vacant Housing Units | 713 ( 6.5%) |
| Median Home Value | $348,818 |
| Average Home Value | $377,633 |
Housing Distribution
Address Breakdown
Residential
10,701
Single Family
10,425
Multi-Family
276
Businesses
685
Nearby investment properties with comparable rents
Nearby investment properties with comparable prices
Listed by: Hadley Faught • eXp Realty, LLC
Mls Name: NNRMLS
Mls Provider:
Mls ID: #250005171
Disclaimer: IDX information is provided exclusively for personal, non-commercial use, and may not be used for any purpose other than to identify prospective properties consumers may be interested in purchasing. Information is deemed reliable but not guaranteed. The content relating to real estate for sale on this web site comes in part from the Broker Reciprocity/ IDX program of the Northern Nevada Regional Multiple Listing Service. Real estate listings held by brokerage firms other than Zillow, Inc. are marked with the Broker Reciprocity logo and detailed information about those listings includes the name of the listing brokerage. Any use of the content other than by a search performed by a consumer looking to purchase or rent real estate is prohibited. 2025 Northern Nevada Regional Multiple Listing Service MLS. All rights reserved.