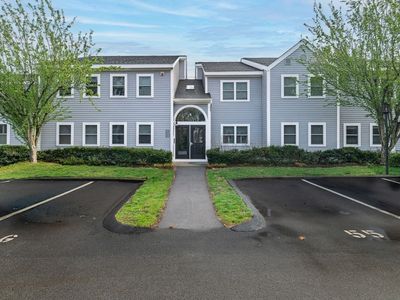
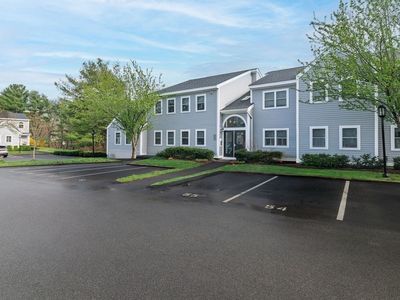
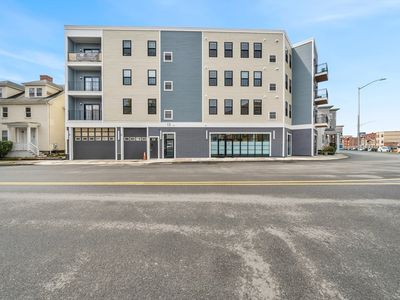
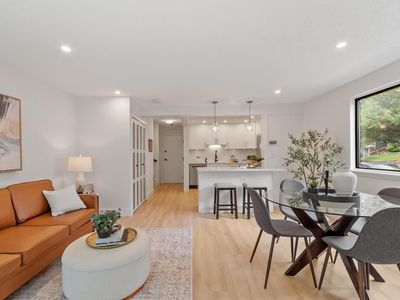
403 Tuckers LnHinghamMA02043
INVESTMENT ANALYSIS
Investment Verdict
Solid Income403 Tuckers Ln, Hingham, MA, 02043 in Hingham carries a 1.54 coverage ratio, rent of $3,212/mo is 1.54 times the $2,091/mo payment. Rental yield 8.29%. That margin gives both the investor and Ziffy Mortgage's DSCR underwriting a comfortable buffer at a $465,000 acquisition price. No U.S. credit or income documentation required. Five-year appreciation adds $128,471; total projected cumulative return: $194,682.
| This Property | City Avg | |
|---|---|---|
| Gross Rental Yield | 8.3% | 5.2% |
| Monthly Cash Flow | $(337) | $500 |
City averages based on Hingham market data in our database. Property projections are estimates.
DSCR Rental Loan Qualification
Qualifies using the property's rental income, not your personal income.
- ✓No W-2, pay stubs, or tax returns needed
- ✓Rental income qualifies you
- ✓Built for real estate investors
| Monthly Rental Income | $3,212 |
| Total Monthly Debt Service | $2,746 |
| DSCR Ratio | 1.17x |
Ziffy Mortgage: Your DSCR most likely meets our 1.0+ requirement, so you'll most probably qualify for our standard DSCR investment loan program. To pre-qualify, book time with your loan officer →
Estimates assume 6.0% rate / 30-yr fixed, 30% down, 1% tax, 0.5% insurance. Not a commitment to lend.
Condo
Built in 1986
N/A lot
$N/A/sqft
No HOA
Neighborhood Data
Neighborhood data shown for ZIP Code: 02043, Hingham, MA area.
Housing Distribution
Housing Statistics
| Category | Value |
|---|---|
| Total HU (Housing Units) | 10,276 (100%) |
| Owner Occupied HU | 7,412 (72.1%) |
| Renter Occupied HU | 2,102 (20.5%) |
| Vacant Housing Units | 762 ( 7.4%) |
| Median Home Value | $1,169,044 |
| Average Home Value | $1,240,940 |
Housing Distribution
Address Breakdown
Residential
9,851
Single Family
7,644
Multi-Family
2,207
Businesses
1,116


Nearby investment properties with comparable rents
Nearby investment properties with comparable prices

Ziffy AI Summary
A quick, investor-focused snapshot highlighting income strength, yield potential.
| Key metrics | Value |
|---|---|
| Price | $399,900 |
| Est. Rent | $3,200/mo |
| ROI | 18% |
- Attractive rent-to-price ratio for income stability
- Good fit for DSCR financing with healthy coverage
Condo
Built in 1986
N/A lot
$N/A/sqft
No HOA
Neighborhood Data
Neighborhood data shown for ZIP Code: 02043, Hingham, MA area.
Housing Distribution
Housing Statistics
| Category | Value |
|---|---|
| Total HU (Housing Units) | 10,276 (100%) |
| Owner Occupied HU | 7,412 (72.1%) |
| Renter Occupied HU | 2,102 (20.5%) |
| Vacant Housing Units | 762 ( 7.4%) |
| Median Home Value | $1,169,044 |
| Average Home Value | $1,240,940 |
Housing Distribution
Address Breakdown
Residential
9,851
Single Family
7,644
Multi-Family
2,207
Businesses
1,116
Nearby investment properties with comparable rents
Nearby investment properties with comparable prices
Listed by: N/A • N/A
Mls Name: MLS PIN
Mls ID: #73505317