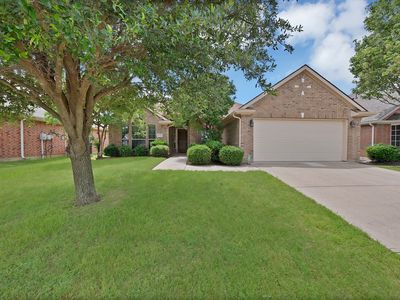
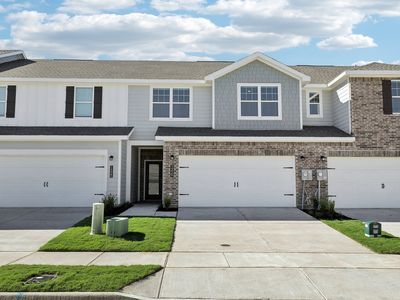
401 Gingerbread LnWaxahachieTX75165

INVESTMENT ANALYSIS
Investment Verdict
Strong Cash Flow401 Gingerbread Ln, Waxahachie, TX, 75165 in Waxahachie is a top-tier cash-flow asset. At $359,600 it produces $3,161/mo in rent and $604/mo in net monthly income, a 10.55% gross rental yield. The DSCR of 1.95 qualifies for Ziffy Mortgage's DSCR loan without W-2s or U.S. credit history. Annual cash flow: $7,243. Five-year appreciation adds $99,351, driving a total cumulative return of $176,655.
| This Property | National Avg | |
|---|---|---|
| Gross Rental Yield | 10.6% | 6.2% |
| Monthly Cash Flow | $604 | $180 |
National averages based on 2024–2025 U.S. residential rental market data. Content is user-generated and unverified.
DSCR Rental Loan Qualification
Qualifies using the property's rental income, not your personal income.
- ✓No W-2, pay stubs, or tax returns needed
- ✓Rental income qualifies you
- ✓Built for real estate investors
| Monthly Rental Income | $3,161 |
| Total Monthly Debt Service | $2,414 |
| DSCR Ratio | 1.31x |
Ziffy Mortgage: Your DSCR most likely meets our 1.0+ requirement, so you'll most probably qualify for our standard DSCR investment loan program. To pre-qualify, book time with your loan officer →
Estimates assume 6.0% rate / 30-yr fixed, 30% down, 1% tax, 0.5% insurance. Not a commitment to lend.
Single Family
Built in 1972
9,147 sqft lot
$N/A/sqft
No HOA
Neighborhood Data
Neighborhood data shown for ZIP Code: 75165, Waxahachie, TX area.
Housing Distribution
Housing Statistics
| Category | Value |
|---|---|
| Total HU (Housing Units) | 21,815 (100%) |
| Owner Occupied HU | 14,366 (65.9%) |
| Renter Occupied HU | 6,168 (28.3%) |
| Vacant Housing Units | 1,281 ( 5.9%) |
| Median Home Value | $351,258 |
| Average Home Value | $396,397 |
Housing Distribution
Address Breakdown
Residential
21,540
Single Family
18,284
Multi-Family
3,256
Businesses
1,381


Nearby investment properties with comparable rents
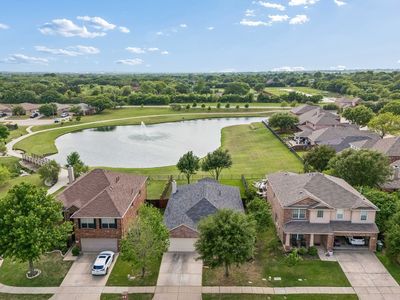
Nearby investment properties with comparable prices

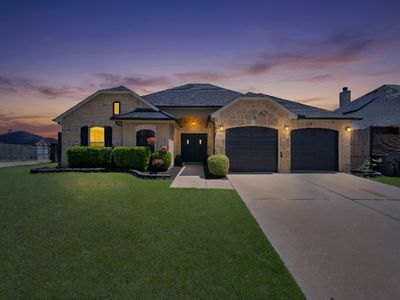
Ziffy AI Summary
A quick, investor-focused snapshot highlighting income strength, yield potential.
| Key metrics | Value |
|---|---|
| Price | $399,900 |
| Est. Rent | $3,200/mo |
| ROI | 18% |
- Attractive rent-to-price ratio for income stability
- Good fit for DSCR financing with healthy coverage
Single Family
Built in 1972
9,147 sqft lot
$N/A/sqft
No HOA
Neighborhood Data
Neighborhood data shown for ZIP Code: 75165, Waxahachie, TX area.
Housing Distribution
Housing Statistics
| Category | Value |
|---|---|
| Total HU (Housing Units) | 21,815 (100%) |
| Owner Occupied HU | 14,366 (65.9%) |
| Renter Occupied HU | 6,168 (28.3%) |
| Vacant Housing Units | 1,281 ( 5.9%) |
| Median Home Value | $351,258 |
| Average Home Value | $396,397 |
Housing Distribution
Address Breakdown
Residential
21,540
Single Family
18,284
Multi-Family
3,256
Businesses
1,381
Nearby investment properties with comparable rents
Nearby investment properties with comparable prices
Listed by: N/A • N/A
Mls Name: undefined
Mls ID: #N/A