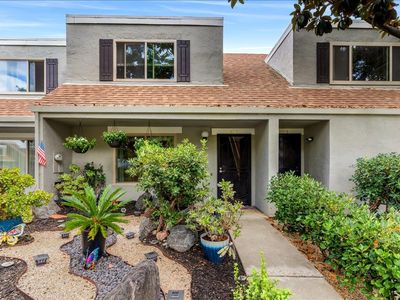
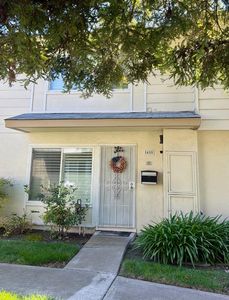
401 Cedargate LnSan JoseCA95136
INVESTMENT ANALYSIS
Investment Verdict
Appreciation Play401 Cedargate Ln, San Jose, CA, 95136 in San Jose is priced for appreciation, not yield. Rental yield 5.92%. At $750,000 with a 5.92% gross yield, the monthly income is modest, but 5% annual price growth is projected to add $207,211 in value over five years, making equity the primary return driver. Ziffy Mortgage's DSCR mortgage (1.10) can still finance this property for non-U.S. residents; a 30–35% down payment typically produces the cleanest underwriting for appreciation-focused assets. Total projected cumulative return: $199,972.
| This Property | City Avg | |
|---|---|---|
| Gross Rental Yield | 5.9% | 6.0% |
| Monthly Cash Flow | $(1,340) | $500 |
City averages based on San Jose market data in our database. Property projections are estimates.
DSCR Rental Loan Qualification
Qualifies using the property's rental income, not your personal income.
- ✓No W-2, pay stubs, or tax returns needed
- ✓Rental income qualifies you
- ✓Built for real estate investors
| Monthly Rental Income | $3,700 |
| Total Monthly Debt Service | $4,741 |
| DSCR Ratio | 0.78x |
Ziffy Mortgage typically prefers a DSCR of 1.0+, but in some cases you may qualify with a DSCR below 1. To explore if this deal qualifies for an investment mortgage, book time with your loan officer →
Estimates assume 6.0% rate / 30-yr fixed, 30% down, 1% tax, 0.5% insurance. Not a commitment to lend.
Townhouse
Built in 1957
N/A lot
$N/A/sqft
$400 monthly HOA
Neighborhood Data
Neighborhood data shown for ZIP Code: 95136, San Jose, CA area.
Housing Distribution
Housing Statistics
| Category | Value |
|---|---|
| Total HU (Housing Units) | 16,863 (100%) |
| Owner Occupied HU | 9,324 (55.3%) |
| Renter Occupied HU | 6,723 (39.9%) |
| Vacant Housing Units | 816 ( 4.8%) |
| Median Home Value | $1,146,088 |
| Average Home Value | $1,136,635 |
Housing Distribution
Address Breakdown
Residential
16,721
Single Family
14,757
Multi-Family
1,964
Businesses
282


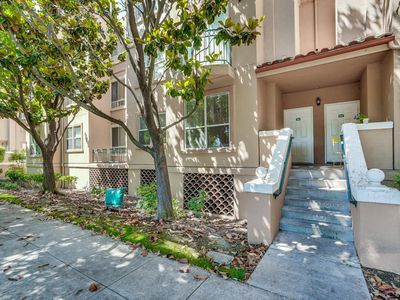
Nearby investment properties with comparable rents

Nearby investment properties with comparable prices
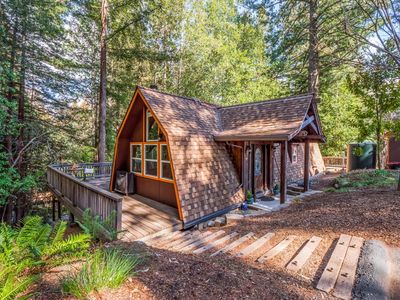

Ziffy AI Summary
A quick, investor-focused snapshot highlighting income strength, yield potential.
| Key metrics | Value |
|---|---|
| Price | $399,900 |
| Est. Rent | $3,200/mo |
| ROI | 18% |
- Attractive rent-to-price ratio for income stability
- Good fit for DSCR financing with healthy coverage
Townhouse
Built in 1957
N/A lot
$N/A/sqft
$400 monthly HOA
Neighborhood Data
Neighborhood data shown for ZIP Code: 95136, San Jose, CA area.
Housing Distribution
Housing Statistics
| Category | Value |
|---|---|
| Total HU (Housing Units) | 16,863 (100%) |
| Owner Occupied HU | 9,324 (55.3%) |
| Renter Occupied HU | 6,723 (39.9%) |
| Vacant Housing Units | 816 ( 4.8%) |
| Median Home Value | $1,146,088 |
| Average Home Value | $1,136,635 |
Housing Distribution
Address Breakdown
Residential
16,721
Single Family
14,757
Multi-Family
1,964
Businesses
282
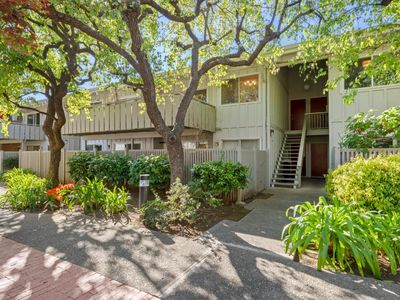
Nearby investment properties with comparable rents
Nearby investment properties with comparable prices
Listed by: Brandon Sullivan • Intero Real Estate Services
Mls Name: MLSListings Inc
Mls Provider:
Mls ID: #ML81999733
Disclaimer: Based on information from the MLSListings MLS as of 2025-09-07 20:48:09 PDT. All data, including all measurements and calculations of area, is obtained from various sources and has not been, and will not be, verified by broker or MLS. All information should be independently reviewed and verified for accuracy. Properties may or may not be listed by the office/agent presenting the information.