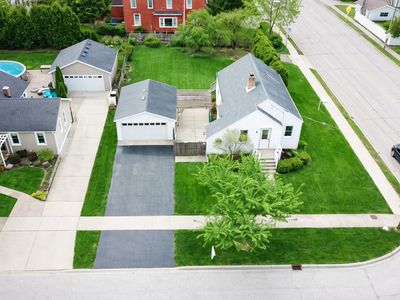
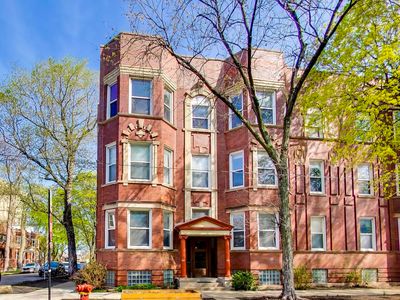
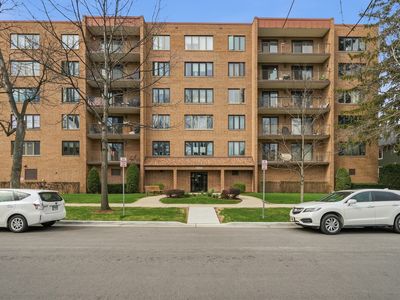
400 Lindley AveWestmontIL60559
INVESTMENT ANALYSIS
Investment Verdict
Strong Cash Flow400 Lindley Ave, Westmont, IL, 60559 in Westmont is a top-tier cash-flow asset. At $350,000 it produces $2,953/mo in rent and $526/mo in net monthly income, a 10.13% gross rental yield. The DSCR of 1.88 qualifies for Ziffy Mortgage's DSCR loan without W-2s or U.S. credit history. Annual cash flow: $6,306. Five-year appreciation adds $96,699, driving a total cumulative return of $167,671.
| This Property | City Avg | |
|---|---|---|
| Gross Rental Yield | 10.1% | 7.0% |
| Monthly Cash Flow | $526 | $1,200 |
City averages based on Westmont market data in our database. Property projections are estimates.
DSCR Rental Loan Qualification
Qualifies using the property's rental income, not your personal income.
- ✓No W-2, pay stubs, or tax returns needed
- ✓Rental income qualifies you
- ✓Built for real estate investors
| Monthly Rental Income | $2,953 |
| Total Monthly Debt Service | $2,288 |
| DSCR Ratio | 1.29x |
Ziffy Mortgage: Your DSCR most likely meets our 1.0+ requirement, so you'll most probably qualify for our standard DSCR investment loan program. To pre-qualify, book time with your loan officer →
Estimates assume 6.0% rate / 30-yr fixed, 30% down, 1% tax, 0.5% insurance. Not a commitment to lend.
Single Family
Built in 1937
0.25 Acres lot
$N/A/sqft
No HOA
Neighborhood Data
Neighborhood data shown for ZIP Code: 60559, Westmont, IL area.
Housing Distribution
Housing Statistics
| Category | Value |
|---|---|
| Total HU (Housing Units) | 11,676 (100%) |
| Owner Occupied HU | 6,529 (55.9%) |
| Renter Occupied HU | 4,489 (38.4%) |
| Vacant Housing Units | 658 ( 5.6%) |
| Median Home Value | $436,150 |
| Average Home Value | $515,152 |
Housing Distribution
Address Breakdown
Residential
10,423
Single Family
6,542
Multi-Family
3,881
Businesses
1,192


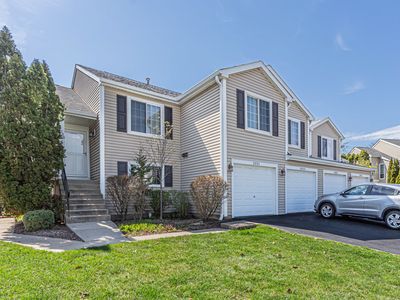
Nearby investment properties with comparable rents
Nearby investment properties with comparable prices

Ziffy AI Summary
A quick, investor-focused snapshot highlighting income strength, yield potential.
| Key metrics | Value |
|---|---|
| Price | $399,900 |
| Est. Rent | $3,200/mo |
| ROI | 18% |
- Attractive rent-to-price ratio for income stability
- Good fit for DSCR financing with healthy coverage
Single Family
Built in 1937
0.25 Acres lot
$N/A/sqft
No HOA
Neighborhood Data
Neighborhood data shown for ZIP Code: 60559, Westmont, IL area.
Housing Distribution
Housing Statistics
| Category | Value |
|---|---|
| Total HU (Housing Units) | 11,676 (100%) |
| Owner Occupied HU | 6,529 (55.9%) |
| Renter Occupied HU | 4,489 (38.4%) |
| Vacant Housing Units | 658 ( 5.6%) |
| Median Home Value | $436,150 |
| Average Home Value | $515,152 |
Housing Distribution
Address Breakdown
Residential
10,423
Single Family
6,542
Multi-Family
3,881
Businesses
1,192
Nearby investment properties with comparable rents
Nearby investment properties with comparable prices