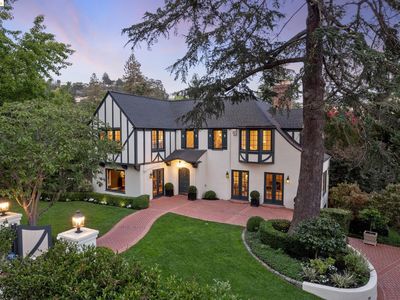
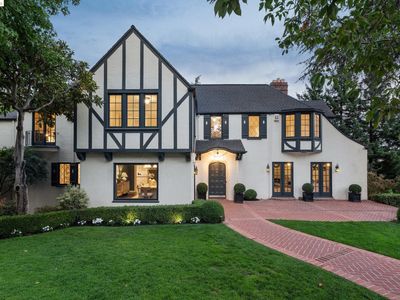
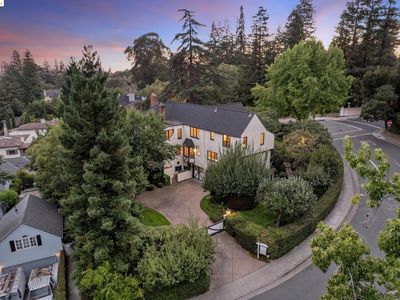
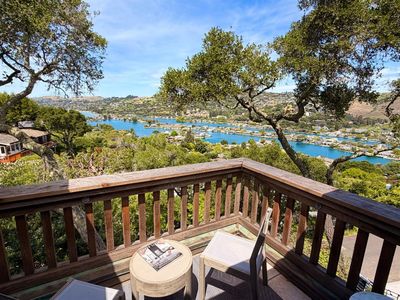
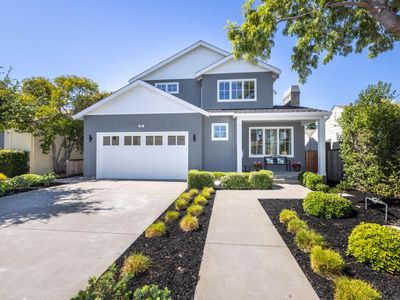
390 Hampton RdPiedmontCA94611
INVESTMENT ANALYSIS
Investment Verdict
Appreciation PlayInvestment property for sale in Piedmont at 390 Hampton Rd, Piedmont, CA, 94611 projects strong ROI of 15.4%. Rental yield 5.65%. With 5% annual appreciation, the property builds $1,159,830 in value over five years. Equity growth combined delivers a projected five-year ROI of 95.69%, translating into $1,134,842 in total cumulative return on $1,185,935 invested capital. You can finance this property with Ziffy Mortgage’s DSCR loan, which leverages the property’s income for qualification rather than your personal income.
| This Property | City Avg | |
|---|---|---|
| Gross Rental Yield | 5.7% | 5.5% |
| Monthly Cash Flow | $(7,165) | $300 |
City averages based on Piedmont market data in our database. Property projections are estimates.
DSCR Rental Loan Qualification
Qualifies using the property's rental income, not your personal income.
- ✓No W-2, pay stubs, or tax returns needed
- ✓Rental income qualifies you
- ✓Built for real estate investors
| Monthly Rental Income | $19,763 |
| Total Monthly Debt Service | $25,258 |
| DSCR Ratio | 0.78x |
Ziffy Mortgage typically prefers a DSCR of 1.0+, but in some cases you may qualify with a DSCR below 1. To explore if this deal qualifies for an investment mortgage, book time with your loan officer →
Estimates assume 6.0% rate / 30-yr fixed, 30% down, 1% tax, 0.5% insurance. Not a commitment to lend.
Single Family
Built in 1921
0.35 Acres lot
$N/A/sqft
No HOA
Neighborhood Data
Neighborhood data shown for ZIP Code: 94611, Oakland, CA area.
Housing Distribution
Housing Statistics
| Category | Value |
|---|---|
| Total HU (Housing Units) | 18,438 (100%) |
| Owner Occupied HU | 10,184 (55.2%) |
| Renter Occupied HU | 7,300 (39.6%) |
| Vacant Housing Units | 954 ( 5.2%) |
| Median Home Value | $1,713,928 |
| Average Home Value | $1,667,447 |
Housing Distribution
Address Breakdown
Residential
18,900
Single Family
12,145
Multi-Family
6,755
Businesses
995


Nearby investment properties with comparable rents

Nearby investment properties with comparable prices

Ziffy AI Summary
A quick, investor-focused snapshot highlighting income strength, yield potential.
| Key metrics | Value |
|---|---|
| Price | $399,900 |
| Est. Rent | $3,200/mo |
| ROI | 18% |
- Attractive rent-to-price ratio for income stability
- Good fit for DSCR financing with healthy coverage
Single Family
Built in 1921
0.35 Acres lot
$N/A/sqft
No HOA
Neighborhood Data
Neighborhood data shown for ZIP Code: 94611, Oakland, CA area.
Housing Distribution
Housing Statistics
| Category | Value |
|---|---|
| Total HU (Housing Units) | 18,438 (100%) |
| Owner Occupied HU | 10,184 (55.2%) |
| Renter Occupied HU | 7,300 (39.6%) |
| Vacant Housing Units | 954 ( 5.2%) |
| Median Home Value | $1,713,928 |
| Average Home Value | $1,667,447 |
Housing Distribution
Address Breakdown
Residential
18,900
Single Family
12,145
Multi-Family
6,755
Businesses
995
Nearby investment properties with comparable rents
Nearby investment properties with comparable prices