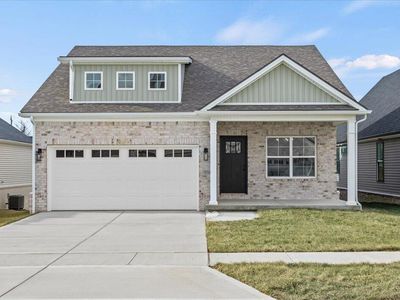
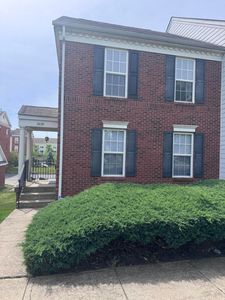
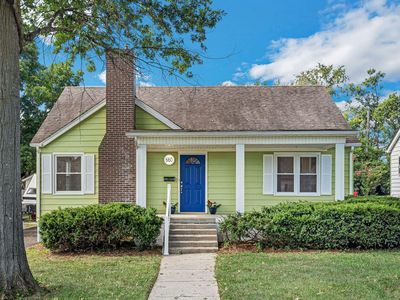
3516 Stolen Horse TrceLexingtonKY40509
INVESTMENT ANALYSIS
Investment Verdict
Solid IncomeThis Lexington rental at 3516 Stolen Horse Trce, Lexington, KY, 40509 sits in the solid-income band: 8.15% gross yield, $2,683/mo rent, $254/mo net after the $1,776/mo debt service, DSCR 1.51. Entry price of $395,000 is well-calibrated for the income it produces. Ziffy Mortgage finances this type of asset on rental income alone, no tax returns, no U.S. credit profile. Projected five-year appreciation of $109,131 and $3,638/yr in principal reduction bring total cumulative return to $166,104.
| This Property | City Avg | |
|---|---|---|
| Gross Rental Yield | 8.2% | 5.2% |
| Monthly Cash Flow | $254 | $385 |
City averages based on Lexington market data in our database. Property projections are estimates.
DSCR Rental Loan Qualification
Qualifies using the property's rental income, not your personal income.
- ✓No W-2, pay stubs, or tax returns needed
- ✓Rental income qualifies you
- ✓Built for real estate investors
| Monthly Rental Income | $2,683 |
| Total Monthly Debt Service | $2,272 |
| DSCR Ratio | 1.18x |
Ziffy Mortgage: Your DSCR most likely meets our 1.0+ requirement, so you'll most probably qualify for our standard DSCR investment loan program. To pre-qualify, book time with your loan officer →
Estimates assume 6.0% rate / 30-yr fixed, 30% down, 1% tax, 0.5% insurance. Not a commitment to lend.
Single Family
Built in 2024
6,242 sqft lot
$N/A/sqft
$300 annually HOA
Neighborhood Data
Neighborhood data shown for ZIP Code: 40509, Lexington, KY area.
Housing Distribution
Housing Statistics
| Category | Value |
|---|---|
| Total HU (Housing Units) | 20,860 (100%) |
| Owner Occupied HU | 11,449 (54.9%) |
| Renter Occupied HU | 7,813 (37.5%) |
| Vacant Housing Units | 1,598 ( 7.7%) |
| Median Home Value | $368,659 |
| Average Home Value | $416,092 |
Housing Distribution
Address Breakdown
Residential
20,444
Single Family
17,889
Multi-Family
2,555
Businesses
1,544


Nearby investment properties with comparable rents


Nearby investment properties with comparable prices

Ziffy AI Summary
A quick, investor-focused snapshot highlighting income strength, yield potential.
| Key metrics | Value |
|---|---|
| Price | $399,900 |
| Est. Rent | $3,200/mo |
| ROI | 18% |
- Attractive rent-to-price ratio for income stability
- Good fit for DSCR financing with healthy coverage
Single Family
Built in 2024
6,242 sqft lot
$N/A/sqft
$300 annually HOA
Neighborhood Data
Neighborhood data shown for ZIP Code: 40509, Lexington, KY area.
Housing Distribution
Housing Statistics
| Category | Value |
|---|---|
| Total HU (Housing Units) | 20,860 (100%) |
| Owner Occupied HU | 11,449 (54.9%) |
| Renter Occupied HU | 7,813 (37.5%) |
| Vacant Housing Units | 1,598 ( 7.7%) |
| Median Home Value | $368,659 |
| Average Home Value | $416,092 |
Housing Distribution
Address Breakdown
Residential
20,444
Single Family
17,889
Multi-Family
2,555
Businesses
1,544
Nearby investment properties with comparable rents
Nearby investment properties with comparable prices
Listed by: Brandon L Hedinger • Keller Williams Bluegrass Realty
Mls Name: Imagine MLS
Mls Provider:
Mls ID: #24025754
Disclaimer: IDX information is provided exclusively for personal, non-commercial use, and may not be used for any purpose other than to identify prospective properties consumers may be interested in purchasing. Information is deemed reliable but not guaranteed.