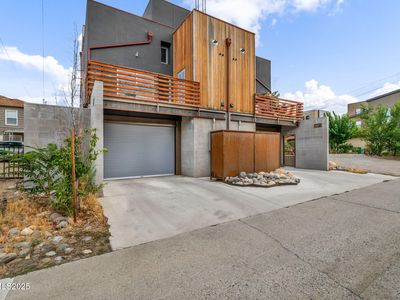
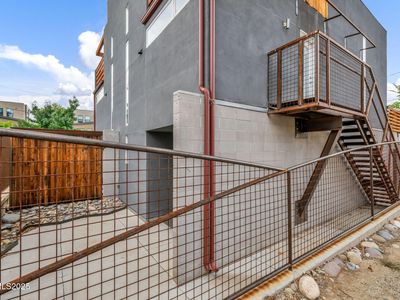
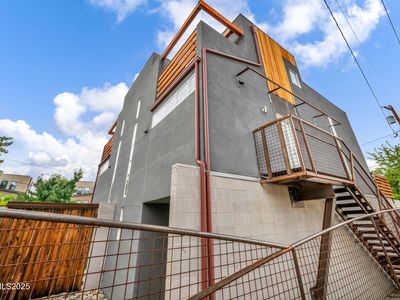
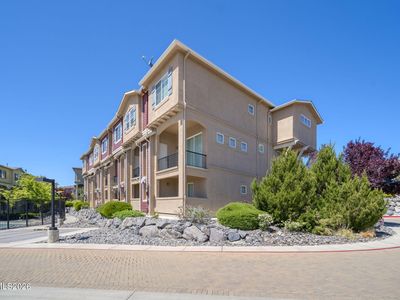
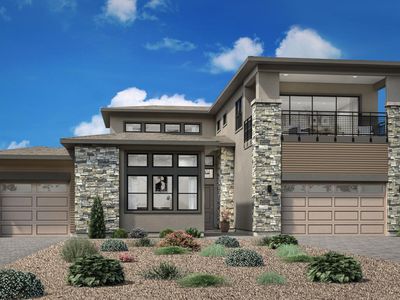
343 & 347 Mount Rose StRenoNV89509
INVESTMENT ANALYSIS
Investment Verdict
Appreciation PlayYield and appreciation often trade off, and at 343 & 347 Mount Rose St, Reno, NV, 89509 in Reno the bet is firmly on appreciation. Rental yield 1.48%. The 1.48% gross yield on a $1,650,000 price is below income-first thresholds, but 5%/yr value growth projects $455,865 in equity by year five. Ziffy Mortgage's non-U.S. DSCR mortgage (0.27) finances the acquisition on rental income alone. A larger down payment (30–35%) reduces monthly debt service and tightens the spread. Total projected cumulative return: $140,525.
| This Property | City Avg | |
|---|---|---|
| Gross Rental Yield | 1.5% | 4.8% |
| Monthly Cash Flow | $(7,493) | $1,850 |
City averages based on Reno market data in our database. Property projections are estimates.
DSCR Rental Loan Qualification
Qualifies using the property's rental income, not your personal income.
- ✓No W-2, pay stubs, or tax returns needed
- ✓Rental income qualifies you
- ✓Built for real estate investors
| Monthly Rental Income | $2,040 |
| Total Monthly Debt Service | $8,877 |
| DSCR Ratio | 0.23x |
Ziffy Mortgage typically prefers a DSCR of 1.0+, but in some cases you may qualify with a DSCR below 1. To explore if this deal qualifies for an investment mortgage, book time with your loan officer →
Estimates assume 6.0% rate / 30-yr fixed, 30% down, 1% tax, 0.5% insurance. Not a commitment to lend.
Multi Family
Built in 1945
6,969 sqft lot
$N/A/sqft
No HOA
Neighborhood Data
Neighborhood data shown for ZIP Code: 89509, Reno, NV area.
Housing Distribution
Housing Statistics
| Category | Value |
|---|---|
| Total HU (Housing Units) | 17,899 (100%) |
| Owner Occupied HU | 9,041 (50.5%) |
| Renter Occupied HU | 7,979 (44.6%) |
| Vacant Housing Units | 879 ( 4.9%) |
| Median Home Value | $704,008 |
| Average Home Value | $783,053 |
Housing Distribution
Address Breakdown
Residential
16,680
Single Family
13,614
Multi-Family
3,066
Businesses
1,226


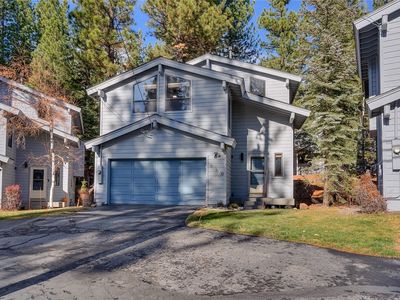
Nearby investment properties with comparable rents
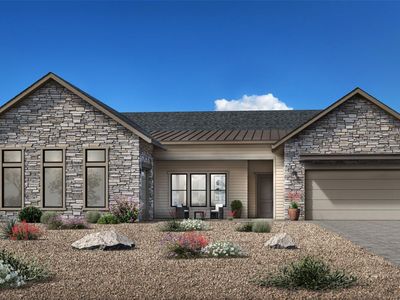
Nearby investment properties with comparable prices

Ziffy AI Summary
A quick, investor-focused snapshot highlighting income strength, yield potential.
| Key metrics | Value |
|---|---|
| Price | $399,900 |
| Est. Rent | $3,200/mo |
| ROI | 18% |
- Attractive rent-to-price ratio for income stability
- Good fit for DSCR financing with healthy coverage
Multi Family
Built in 1945
6,969 sqft lot
$N/A/sqft
No HOA
Neighborhood Data
Neighborhood data shown for ZIP Code: 89509, Reno, NV area.
Housing Distribution
Housing Statistics
| Category | Value |
|---|---|
| Total HU (Housing Units) | 17,899 (100%) |
| Owner Occupied HU | 9,041 (50.5%) |
| Renter Occupied HU | 7,979 (44.6%) |
| Vacant Housing Units | 879 ( 4.9%) |
| Median Home Value | $704,008 |
| Average Home Value | $783,053 |
Housing Distribution
Address Breakdown
Residential
16,680
Single Family
13,614
Multi-Family
3,066
Businesses
1,226
Nearby investment properties with comparable rents
Nearby investment properties with comparable prices