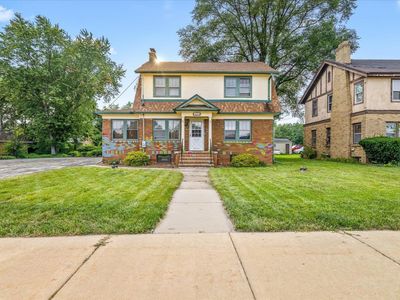
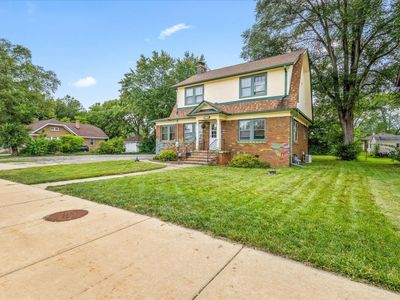
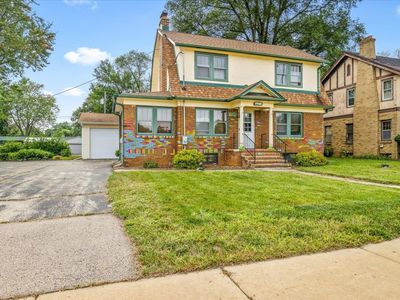
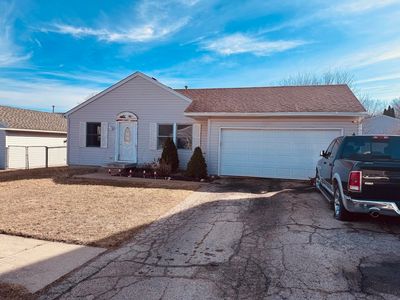
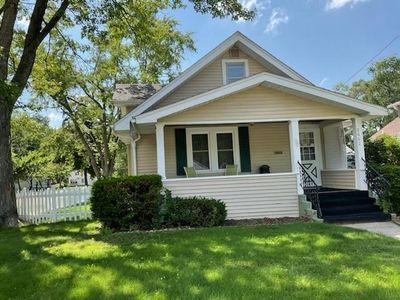
3128 N Main StRockfordIL61103
INVESTMENT ANALYSIS
Investment Verdict
Solid IncomeThis is a cash-flow-light asset: 3128 N Main St, Rockford, IL, 61103 in Rockford, $179,000, 9.24% gross yield, $136/mo net income. Consider it a market-entry position, the $1,378/mo rent covers the $805/mo payment with a margin, and 5%/yr appreciation is projected to add $49,454 to the asset's value over five years. Ziffy Mortgage approves DSCR loans (coverage 1.71) for non-U.S. residents without domestic income documentation. Consider a higher down payment to widen the monthly margin. Total projected return: $77,247.
| This Property | City Avg | |
|---|---|---|
| Gross Rental Yield | 9.2% | 9.2% |
| Monthly Cash Flow | $136 | $450 |
City averages based on Rockford market data in our database. Property projections are estimates.
DSCR Rental Loan Qualification
Qualifies using the property's rental income, not your personal income.
- ✓No W-2, pay stubs, or tax returns needed
- ✓Rental income qualifies you
- ✓Built for real estate investors
| Monthly Rental Income | $1,378 |
| Total Monthly Debt Service | $1,170 |
| DSCR Ratio | 1.18x |
Ziffy Mortgage: Your DSCR most likely meets our 1.0+ requirement, so you'll most probably qualify for our standard DSCR investment loan program. To pre-qualify, book time with your loan officer →
Estimates assume 6.0% rate / 30-yr fixed, 30% down, 1% tax, 0.5% insurance. Not a commitment to lend.
Single Family
Built in 1930
0.39 Acres lot
$N/A/sqft
No HOA
Neighborhood Data
Neighborhood data shown for ZIP Code: 61103, Rockford, IL area.
Housing Distribution
Housing Statistics
| Category | Value |
|---|---|
| Total HU (Housing Units) | 11,046 (100%) |
| Owner Occupied HU | 5,025 (45.5%) |
| Renter Occupied HU | 4,904 (44.4%) |
| Vacant Housing Units | 1,117 (10.1%) |
| Median Home Value | $143,110 |
| Average Home Value | $176,481 |
Housing Distribution
Address Breakdown
Residential
10,229
Single Family
8,022
Multi-Family
2,207
Businesses
400


Nearby investment properties with comparable rents
Nearby investment properties with comparable prices


Ziffy AI Summary
A quick, investor-focused snapshot highlighting income strength, yield potential.
| Key metrics | Value |
|---|---|
| Price | $399,900 |
| Est. Rent | $3,200/mo |
| ROI | 18% |
- Attractive rent-to-price ratio for income stability
- Good fit for DSCR financing with healthy coverage
Single Family
Built in 1930
0.39 Acres lot
$N/A/sqft
No HOA
Neighborhood Data
Neighborhood data shown for ZIP Code: 61103, Rockford, IL area.
Housing Distribution
Housing Statistics
| Category | Value |
|---|---|
| Total HU (Housing Units) | 11,046 (100%) |
| Owner Occupied HU | 5,025 (45.5%) |
| Renter Occupied HU | 4,904 (44.4%) |
| Vacant Housing Units | 1,117 (10.1%) |
| Median Home Value | $143,110 |
| Average Home Value | $176,481 |
Housing Distribution
Address Breakdown
Residential
10,229
Single Family
8,022
Multi-Family
2,207
Businesses
400
Nearby investment properties with comparable rents
Nearby investment properties with comparable prices