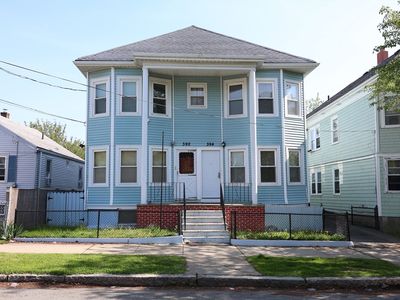
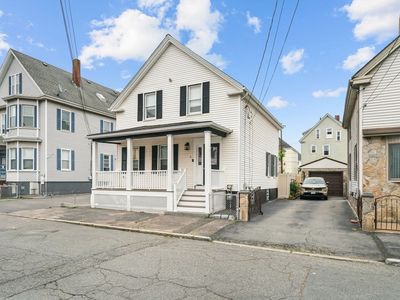
29 James StNew BedfordMA02740

INVESTMENT ANALYSIS
Investment Verdict
Steady Equity Builder29 James St, New Bedford, MA, 02740 in New Bedford earns a respectable 7.97% gross yield at $413,000, but after the $1,857/mo mortgage the net cash flow is $135/mo, a tight but positive spread. Expense discipline (vacancy, management, maintenance) will determine whether the margin widens. Ziffy Mortgage's DSCR mortgage (1.29) still qualifies on property income; a larger down payment can improve the cash-flow buffer. Long-term, 5% appreciation projects $114,104 over five years, making equity the dominant return driver. Total projected return: $143,778.
| This Property | City Avg | |
|---|---|---|
| Gross Rental Yield | 8% | 6.1% |
| Monthly Cash Flow | $135 | $420 |
City averages based on New Bedford market data in our database. Property projections are estimates.
DSCR Rental Loan Qualification
Qualifies using the property's rental income, not your personal income.
- ✓No W-2, pay stubs, or tax returns needed
- ✓Rental income qualifies you
- ✓Built for real estate investors
| Monthly Rental Income | $2,400 |
| Total Monthly Debt Service | $2,439 |
| DSCR Ratio | 0.98x |
Ziffy Mortgage typically prefers a DSCR of 1.0+, but in some cases you may qualify with a DSCR below 1. To explore if this deal qualifies for an investment mortgage, book time with your loan officer →
Estimates assume 6.0% rate / 30-yr fixed, 30% down, 1% tax, 0.5% insurance. Not a commitment to lend.
Multi Family
Built in 1910
3,049 sqft lot
$N/A/sqft
No HOA
Neighborhood Data
Neighborhood data shown for ZIP Code: 02740, New Bedford, MA area.
Housing Distribution
Housing Statistics
| Category | Value |
|---|---|
| Total HU (Housing Units) | 21,079 (100%) |
| Owner Occupied HU | 7,962 (37.8%) |
| Renter Occupied HU | 11,861 (56.3%) |
| Vacant Housing Units | 1,256 ( 6.0%) |
| Median Home Value | $374,976 |
| Average Home Value | $421,127 |
Housing Distribution
Address Breakdown
Residential
16,625
Single Family
12,919
Multi-Family
3,706
Businesses
1,302


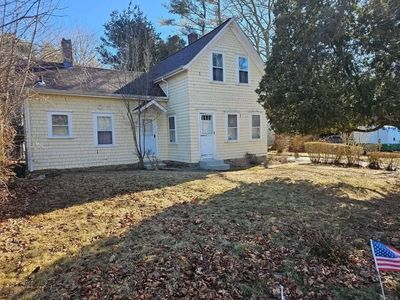
Nearby investment properties with comparable rents
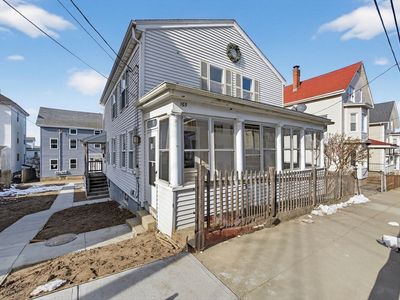
Nearby investment properties with comparable prices

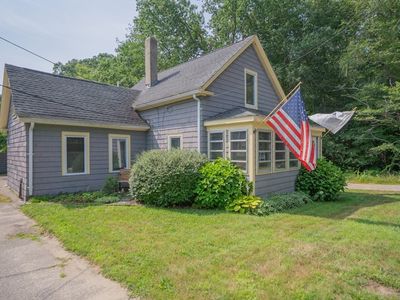

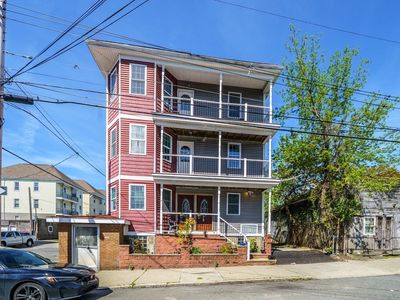
Ziffy AI Summary
A quick, investor-focused snapshot highlighting income strength, yield potential.
| Key metrics | Value |
|---|---|
| Price | $399,900 |
| Est. Rent | $3,200/mo |
| ROI | 18% |
- Attractive rent-to-price ratio for income stability
- Good fit for DSCR financing with healthy coverage
Multi Family
Built in 1910
3,049 sqft lot
$N/A/sqft
No HOA
Neighborhood Data
Neighborhood data shown for ZIP Code: 02740, New Bedford, MA area.
Housing Distribution
Housing Statistics
| Category | Value |
|---|---|
| Total HU (Housing Units) | 21,079 (100%) |
| Owner Occupied HU | 7,962 (37.8%) |
| Renter Occupied HU | 11,861 (56.3%) |
| Vacant Housing Units | 1,256 ( 6.0%) |
| Median Home Value | $374,976 |
| Average Home Value | $421,127 |
Housing Distribution
Address Breakdown
Residential
16,625
Single Family
12,919
Multi-Family
3,706
Businesses
1,302
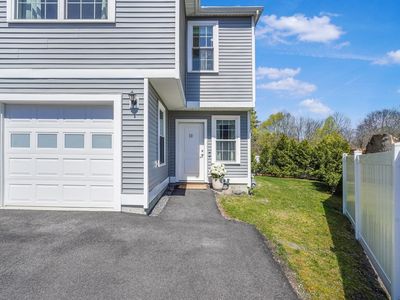
Nearby investment properties with comparable rents
Nearby investment properties with comparable prices
Listed by: N/A • N/A
Mls Name: undefined
Mls ID: #N/A